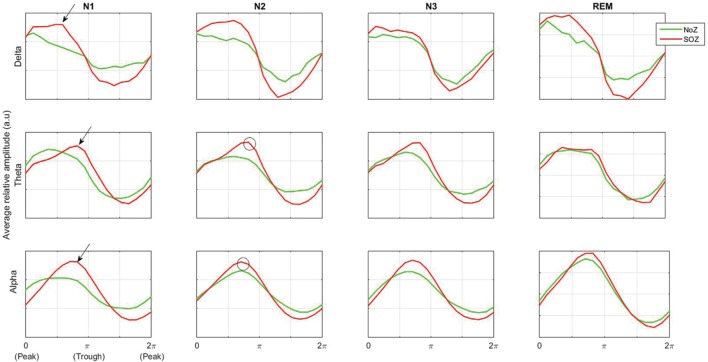
FIGURE 6.
Average ripple band amplitude as a function of low-frequency phase in normal and SOZ channels. Phases 0 and π correspond to the low-frequency band peak and trough respectively. The difference in preferred coupling phase in theta and alpha bands compared to delta band is shown by black arrows. More high frequency activity is seen at the trough of theta and alpha rhythms (black circles). NoZ, normal zone; SOZ, seizure onset zone.

