Figure 1.
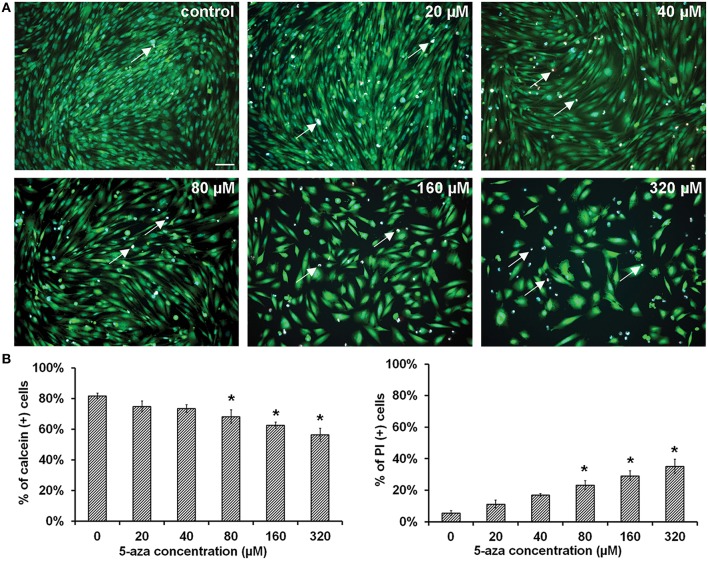
Viability of MUCs following 5-aza treatment. (A) Calcein and PI were used to determine the viability of MUCs treated with 0, 20, 40, 80, 160, and 320 μM 5-aza (n = 5). Hoechst 33,342 was used to label all nuclei (blue), calcein for viable cells (green), PI for dead cells (red, double labeled with Hoechst 33,342 thus showing in pink, arrows). Scale bar, 100 μm. (B) The percentage of viable cells decreased with the 5-aza concentration, whereas percentage of dead cells increased, which was significantly different (P < 0.05 ANOVA). Tukey post-hoc test suggested that 20–40 μM 5-aza did not cause obvious cell death (P > 0.05).

