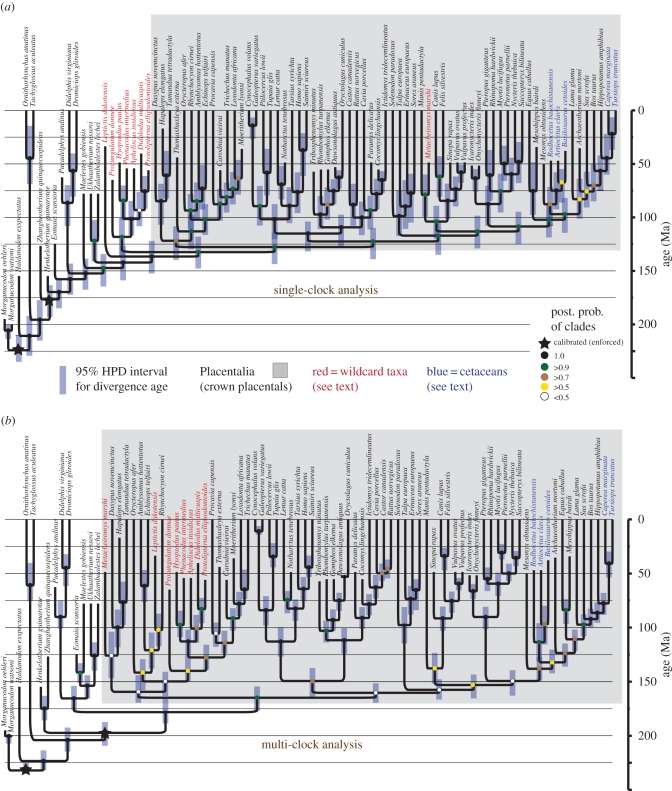
Figure 2.
Bayesian total-evidence tip-dated trees of mammals using (a) a single clock for all morphological and molecular traits, and (b) eight separate clocks (seven for morphology; one for DNA) with groupings as per figure 1. Note in (a) the anomalously basal position of many taxa (red) traditionally considered crown placentals, but also the shallower divergence dates (tabled in file C12). Posterior probabilities are colour-coded; exact values are presented in files C4 and C9. (Online version in colour.)

