Figure 2.

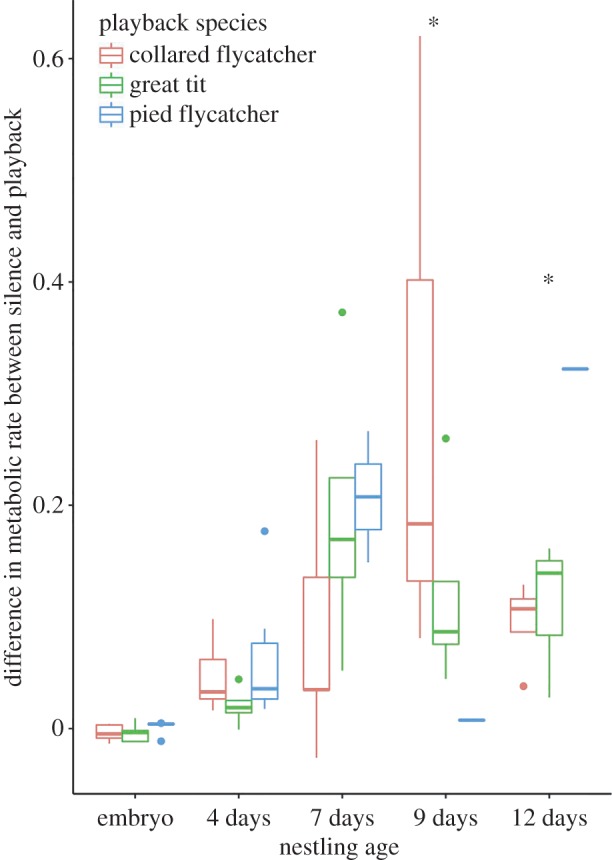
The differences in metabolic response of collared flycatchers at five different ages when played conspecific and two different heterospecific songs, displayed as a Tukey's boxplot. The asterisks denote a significant interaction.

The differences in metabolic response of collared flycatchers at five different ages when played conspecific and two different heterospecific songs, displayed as a Tukey's boxplot. The asterisks denote a significant interaction.