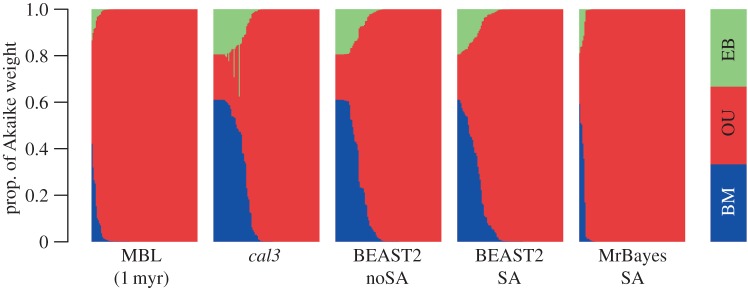
Figure 2.
The fit of models of body-size evolution across different sets of trees, each from a different approach for obtaining dated phylogenies. The right-most set is trees with edge lengths constrained to a minimum length of 1 myr; for all others, see caption for figure 1. Models are fit to a single dated tree, with Akaike weights for each model, for that tree (which sum to 1), figured as a bar along with other trees from that sample, as a block of 100 stacked barplots with borders removed. The barplots for each sample are reordered relative to their support for Brownian motion (BM), versus Ornstein–Uhlenbeck (OU) and early burst (EB). (Online version in colour.)

