
Figure 1.
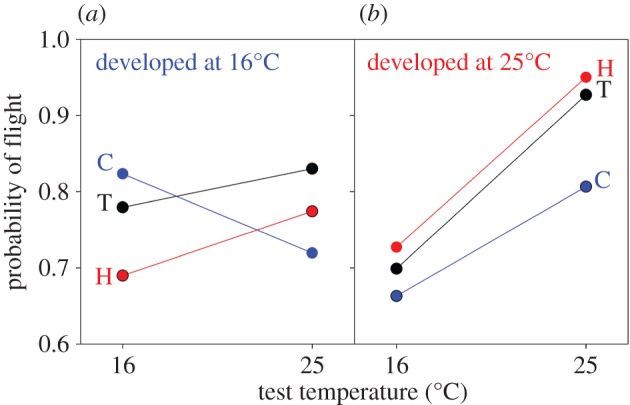
Flies performed best when they were raised and tested at the temperature experienced by their ancestors. Data are mean probabilities of flight estimated from multimodel averaging. Data for flies that developed at (a) 16°C and (b) 25°C. The text next to each datum denotes the selective environment (H, C or T).