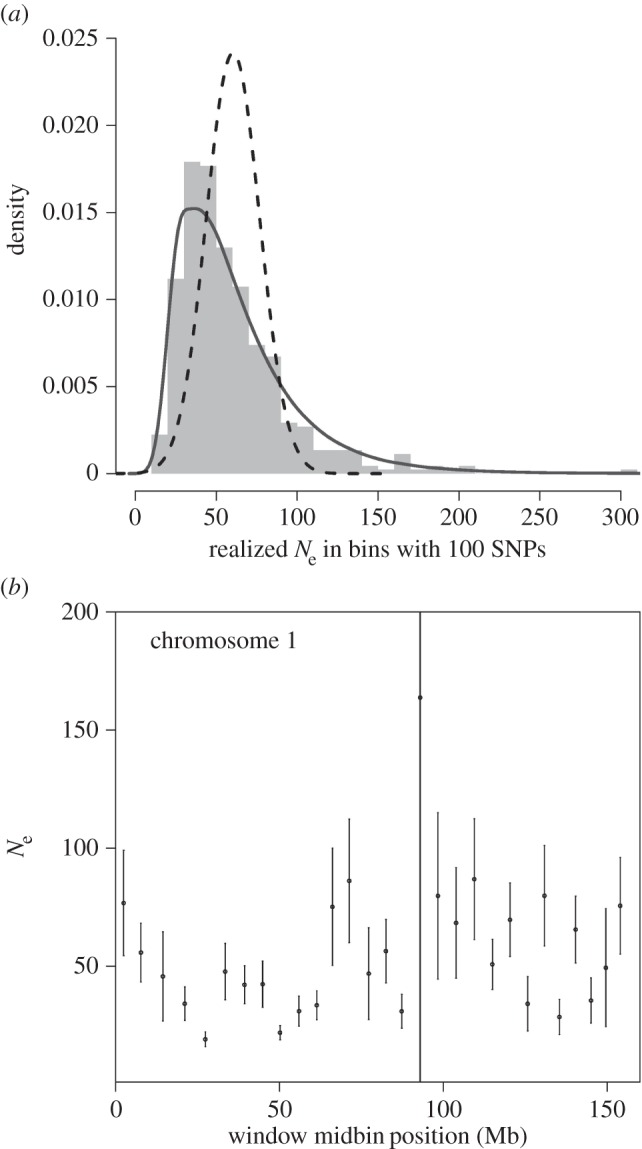
Figure 1.

Heterogeneity of estimated Ne in genomic windows. (a) Distribution of Ne over one generation (1995–2000) in 447 windows. Histogram: empirical distribution of Ne estimates. Dashed line: distribution expected under homogeneous Ne and incorporating standard errors on estimated Ne (electronic supplementary material, figure S5). Solid line: expected distribution for the estimated Ne under a model accounting for standard errors as above and further assuming lognormally distributed parametric variation in Ne among windows (see the electronic supplementary material). (b) Example of within-chromosome heterogeneity in estimated Ne. Each dot represents the Ne estimated per window. Errors bars indicate 1 s.e. (estimated by bootstrapping).
