
Figure 2.
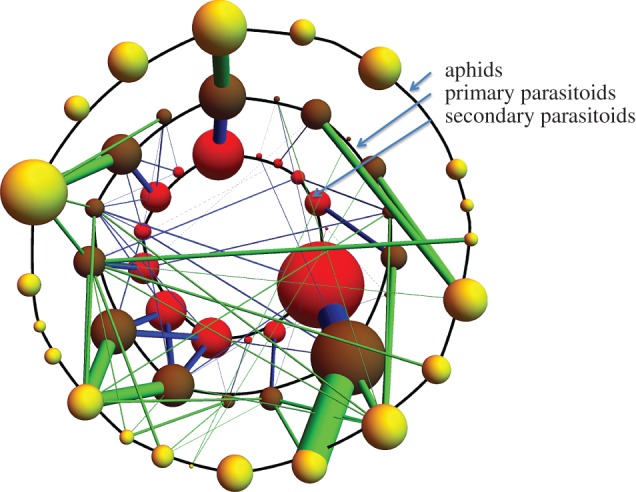
Quantitative food web describing the interactions between aphids and their parasitoids and hyperparasitoids. The yellow spheres arranged in a ring represent the aphid species in a community inhabiting an abandoned field in the south of England. The volumes of the spheres represent the relative densities of the aphid species. Not all aphids are attacked by primary parasitoids but where they are the interaction is represented by green bars connected to brown spheres, the latter representing different primary parasitoids. The width of the bars and the size of the brown spheres represent the relative abundances of primary parasitoids (on a different scale to aphid abundances). Secondary parasitoids (red spheres) have trophic links (blue bars) to primary parasitoids. Again the thickness of bars and size of spheres represent the relative abundance of secondary parasitoids (on their scale).