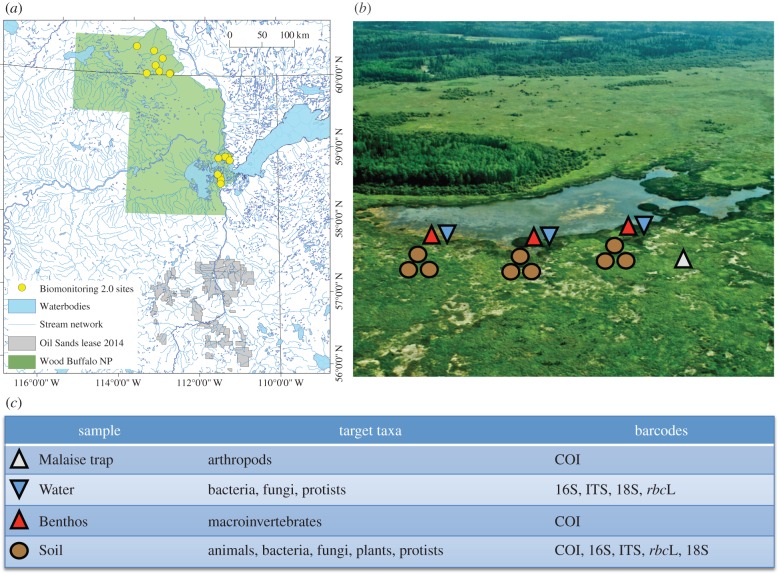
Figure 3.
Biomonitoring 2.0, (a) a map of Wood Buffalo National Park, Alberta/NWT, indicating 16 sampling sites visited by the Biomonitoring 2.0 project from 2011 to 2014; (b) a photo of Egg Lake wetland, indicating spatial coverage of habitat samples collected from soil (brown circles), benthos (red triangles), water column (blue triangles) and malaise trap (white triangle); (c) DNA barcodes employed to capture biodiversity information from different habitat samples using metabarcoding.

