
Figure 4.
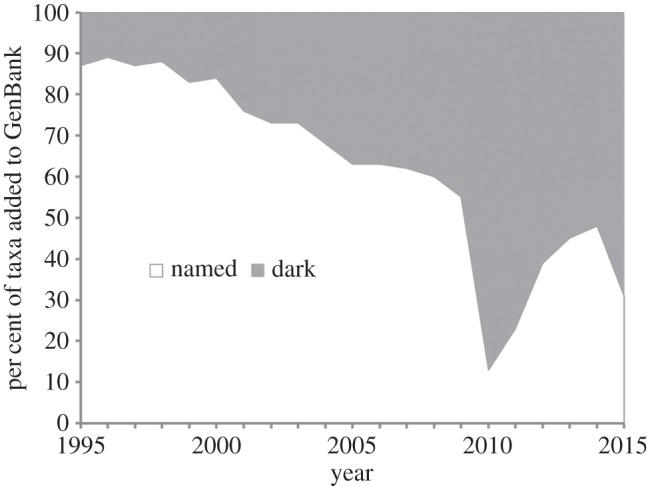
Growth of dark taxa in GenBank for invertebrate sequences. For each year, the graph shows the percentage of species-level ‘invertebrate’ taxa added during that year that do not have formal scientific names. The prominent drop in relative proportion of named taxa around 2010 is due to the addition of DNA barcodes from BOLD that lacked formal scientific names.