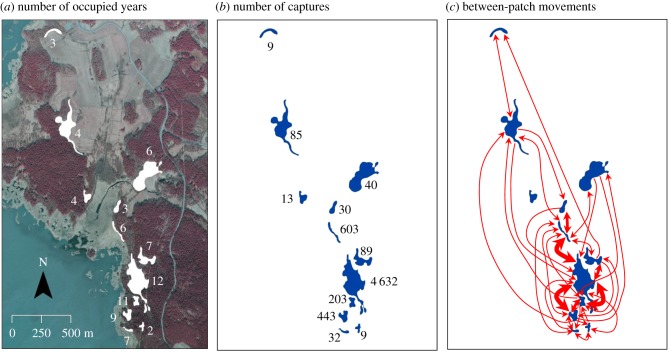
Figure 1.
Maps of the studied butterfly metapopulation with information on (a) the number of years of butterfly occupancy for the 12 suitable habitat patches plotted on an aerial photograph, (b) total number of butterfly capture events in different patches, and (c) frequency of observed between-patch movements during 2004–2015. Arrows indicate directions of movements and their width indicate the frequency of detected movements between pairs of habitat patches: the narrowest arrow less than 10, medium wide arrow more than 15, and the widest arrow more than 50 movements. (Online version in colour.)

