
Figure 5.
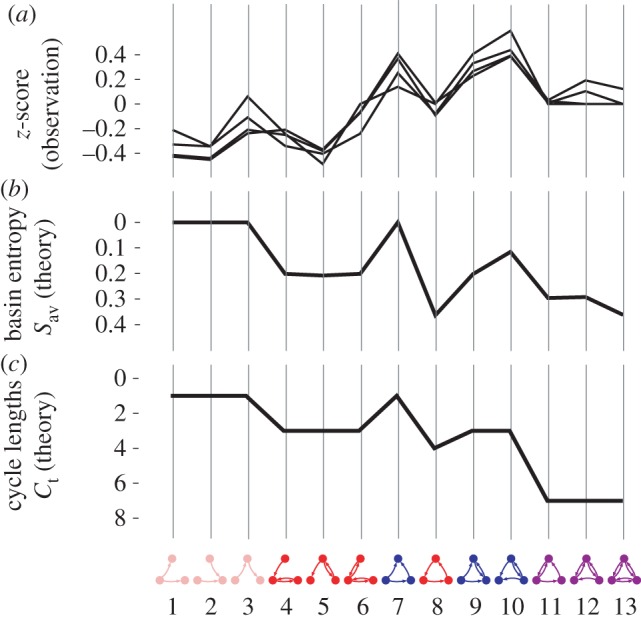
This figure compares the average basin entropy Sav and the total number of distinct cycles Ct with the enrichments, in four real-world regulatory and neural networks, of the 13 connected three-node motifs without self-interactions. The four networks are two developmental transcription networks in fruit fly and sea urchin, a signal-transduction network of mammalian cells, and the neural network of Caenorhabditis elegans. These data are adapted directly from the seminal study of these 13 motifs in [2] and were kindly made available by the authors of this work. (a) The enrichment profiles for these networks are shown relative to a null model, in the form of a z-score. Note that the motifs without any feedback loops (7, 9 and 10) are the most prevalent. (b) The values of the basin entropy Sav are shown for the same motifs on an inverted scale, and exhibit a striking similarity to the motif z-scores. On this inverted scale, the former shows a slight downwards trend with increasing edge number in the motifs, whereas the latter shows a slight upwards trend. The successive gradients of these two profiles however match almost perfectly. To separate the effects of edge number from other characteristics of motif structure, we compare the successive differences in z-score between motifs ΔZ with the differences in average basin entropy ΔSav and find that these show a strong correlation with a Pearson coefficient of −0.7862. (c) The values of Ct, the total number of distinct cycle lengths, for these motifs, which follow a similar pattern to the z-scores and Sav. The correlation of the successive differences ΔZ and ΔCt is similarly high (−0.8166). Note that Ct, like Sav, is shown on an inverted scale.