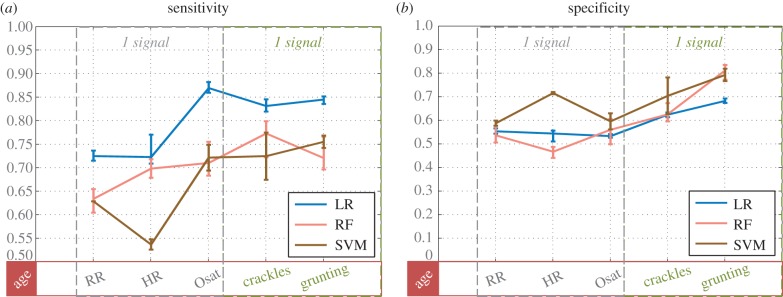
Figure 4.
Classifiers' performance in determining severity, reported as sensitivity (a) and specificity (b) for an increasing number of features. Along the x-axis, features are listed in an additive manner, i.e. each x-entry represents classification with that specific feature and all features on the left of it. Additionally, age was added to the classifier throughout. Values represent the mean as well as the minimum and maximum values attained across the multiple iterations. Note that the scale of the y-axis is different in each plot. Features that can be derived from the same measurement/signal have been listed adjacently and surrounded by a dashed box.

