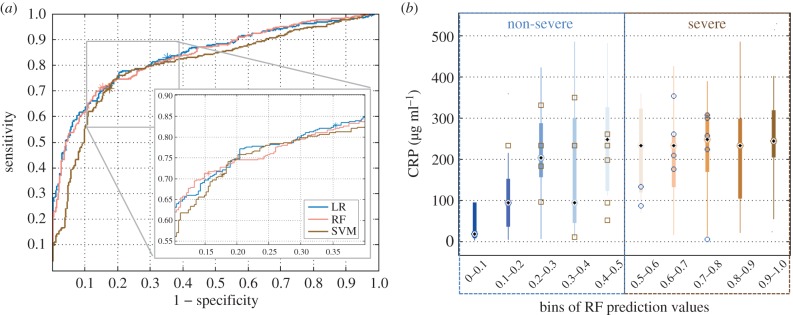
Figure 5.
(a) Receiver operating characteristic (ROC) curve for the three classifier applied to the problem of determining severity; the location of the test results on the ROC curve as per the MCC optimization are denoted via an asterisk. (b) Distribution of CRP values across 10 probabilistic groups/bins. Along the x-axis, the range of RF probabilistic predictions was divided into 10 bins, where bin 1 contains cases assigned probabilities between [0,0.1], i.e. 90–100% certainty of non-severe pneumonia, and bin 10 contains cases assigned probabilities between [0.9,1], i.e. 90–100% certainty of severe pneumonia. The number of predicted cases in bins 1–10 were: 29, 21, 14, 23, 12, 7, 19, 23, 23, 28. In each bin, the feature distribution of correctly classified cases is visualized via a boxplot. In each box, the central dot represents the median, the edges are the 25th and the 75th percentiles, and the thin lines extend to the most extreme data points. Misclassified cases in each bin are plotted on top of the boxplot with squares denoting severe cases and circles denoting non-severe ones.

