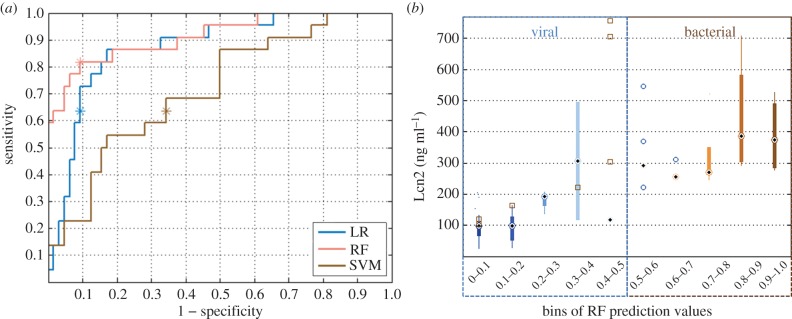
Figure 6.
(a) Receiver operating characteristic (ROC) curve for the three classifier applied to the problem of aetiology determination; the location of the test results on the ROC curve as per the MCC optimization are denoted via an ‘asterisk’. (b) Distribution of Lcn2 values across 10 probabilistic bins, presented as in figure 5. The number of predicted cases in bins 1–10 were: 42, 14, 4, 3, 4, 4, 2, 5, 4, 7. Misclassified cases in each bin are plotted on top of the boxplot with squares denoting bacterial and circles denoting viral cases.

