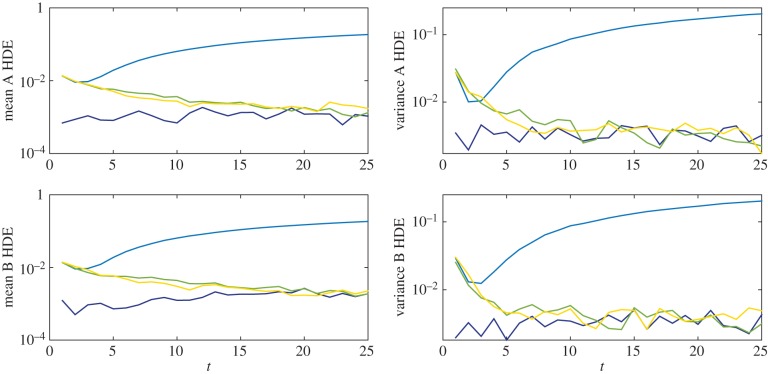
Figure 12.
HDE values for the mean and variance of the multi-species simulation results at discrete times t = 1,2, … ,25. The growing deviation of the partially excluding model (plotted in light blue) from the other three models (fully excluding, Voronoi, and pseudo-compartment, plotted in dark blue, green and yellow, respectively) can be clearly seen in each case.

