
Figure 1.
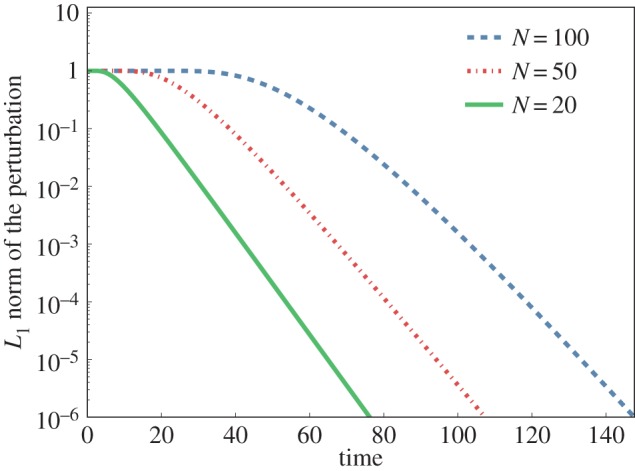
Decrease with time of |Ct|, the L1 norm of the vector of concentrations of a tracer. Identical results apply to |δC|, the L1 norm of the vector of perturbed concentrations. The initial perturbation at t = 0 is localized at a site in the middle of the chain of reactions. The y-axis is on a log scale so that one can see the asymptotic exponential decay as a straight line of slope −1/τ: τ20 = 4.92, τ50 = 5.65 and τ100 = 5.78. All N MA reactions have a = 2 and b = 1. Cases with N = 20, 50 and 100 are shown.