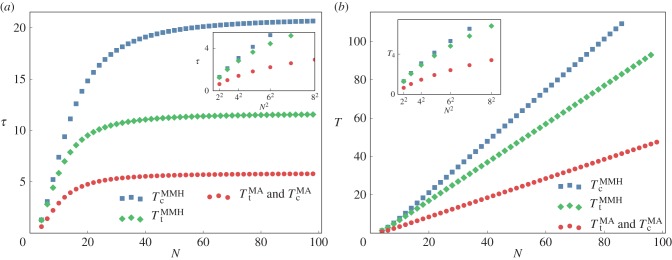
Figure 2.
(a) Relaxation times (τt and τc) and (b) lifetimes (Tt and Tc) for networks between 2 and 100 metabolites long using the MA or the MMH frameworks. Parameters: a = 2 and b = 1, K(S) = K(P) = 2 and α = aK(S) and β = bK(P) so that the conditions are comparable. The large N relaxation times are, respectively, 

 The crossover sizes between a quadratic and constant or linear behaviour are

 The insets illustrate the quadratic dependence on N for

