Figure 3.

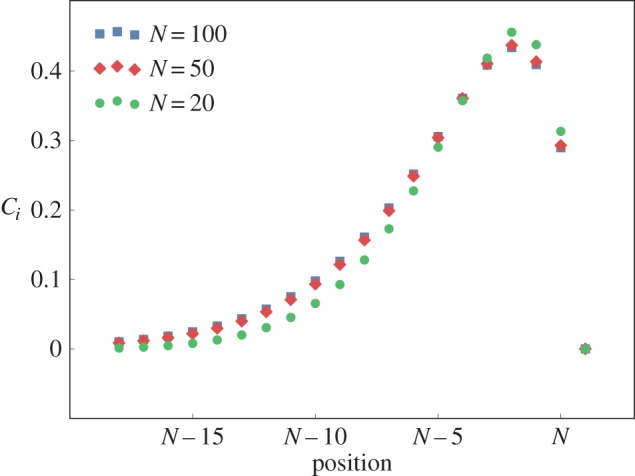
Leading eigenmode profile for the last 20 metabolites of the one-dimensional network when using MA kinetics. Parameters: a = 2, b = 1, and N = 20, 50, 100.

Leading eigenmode profile for the last 20 metabolites of the one-dimensional network when using MA kinetics. Parameters: a = 2, b = 1, and N = 20, 50, 100.