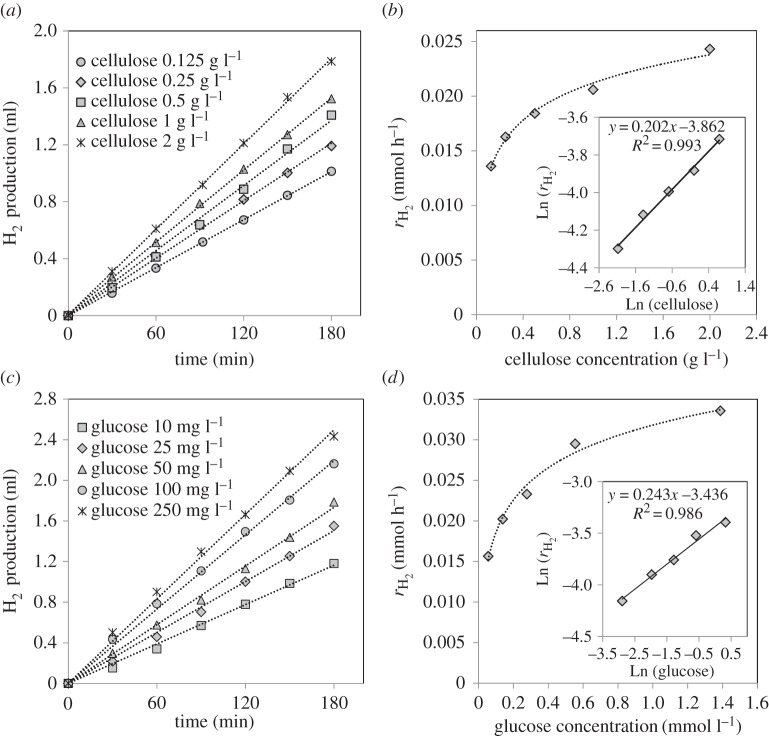
Figure 7.
Effect of cellulose and glucose initial concentration on H2 production (a,c), and the rate of H2 (rH2) versus cellulose and glucose initial concentration (b,d). The inset figures show the fitting plot of Ln(rH2) versus LnC (C = initial concentration of cellulose/glucose). Dotted lines are to guide the eye. Reaction conditions: 200 ml H2O, 150 mg 0.2% Pt/TiO2, temperature = 60°C.

