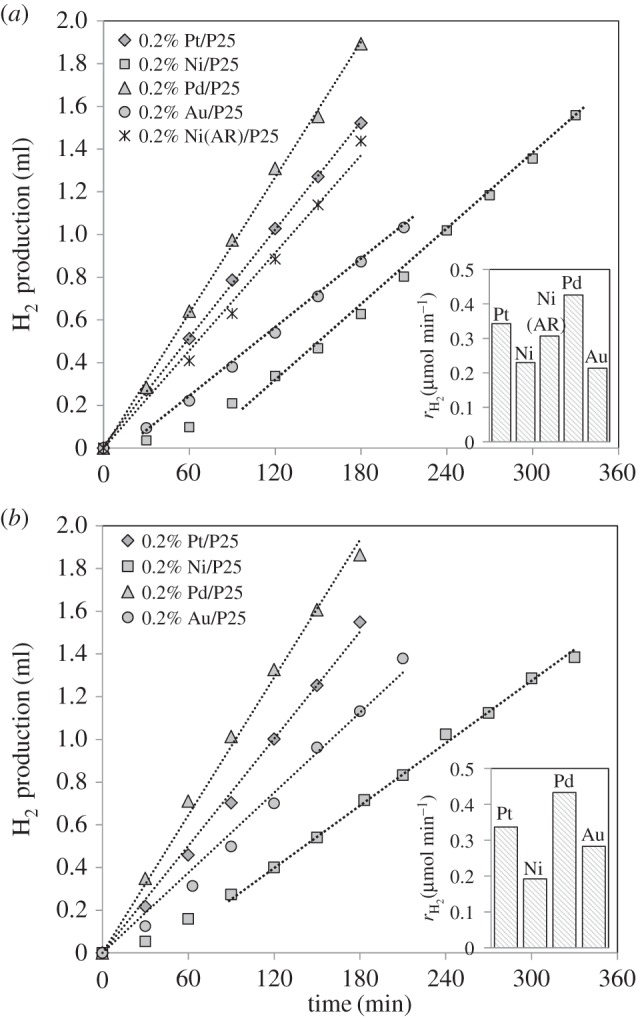
Figure 8.

Influence of the co-catalyst on the hydrogen evolution for cellulose photoreforming (a) and for glucose photoreforming (b). Reaction conditions: 200 mg cellulose (a) and 25 mg l−1 glucose (b), 200 ml H2O, 150 mg catalyst, temperature = 60°C. The inset figure shows the H2 production rate for each catalyst.
