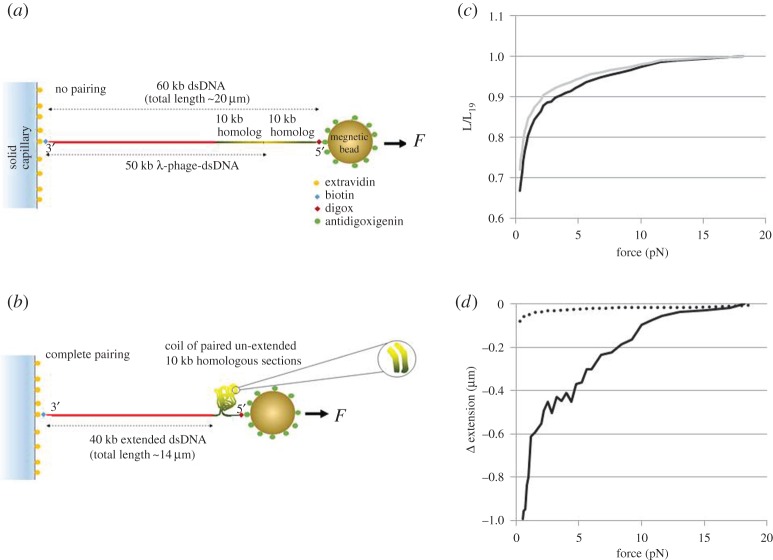
Figure 1.
Schematic of the looped dsDNA unfolding experiments for the case of (a) no pairing and (b) complete pairing. The construct is built from 50 kb λ-phage dsDNA ligated at the end to a 10 kb homologous fragment (for details see the main text). Here, the red lines represent the part of dsDNA which is not identical in sequence to the 10 kb fragment. The two 10 kb sequences which are identical to each other are shown in green to yellow shading to indicate which way the two sequences run (the yellow indicating the end sequence of the λ-phage DNA). When the constructs are fully extended the two homologous pieces run in opposite directions, but when folded any paired tracts will run in the same direction. Shown in (b) is a coil–expected form for the DNA – where the magnification shows that, where pairing occurs, two sections may align so that their identical sequences read in the same direction. (c) Is a representative result showing the extension versus force curves (decreasing force only) in 150 mM NaCl–PBS at 25°C for a dsDNA construct (solid) and a control curve for a 60 kb dsDNA in the same ionic conditions (dashed). The y-axis is normalized to L19, the measured extension of the controls at 19 pN. Further experimental data curves for different ionic conditions are given in the electronic supplementary material, S1. (d) The solid line shows the difference between the two curves (here, defined as the extension of the construct minus the experimentally measured control) shown in (c), multiplied by L19, resulting in negative values since the extension of the paired dsDNA is shorter than the 60 kb control. The dotted line shows the standard deviation for 25 controls. At forces less than 2 pN, the constructs containing homologous regions show significant variation, but even at 5 pN the difference between the constructs and controls is more than 10 times the standard deviation in the controls. The results indicate a significant interaction between identical DNA tracts, which affects the extension–force curve even when the applied force exceeds 10 pN. Experiments for higher temperatures (37°C and 40°C) have also been performed that are not shown here; they demonstrate qualitatively similar effect of ‘homology recognition’; the data for these temperatures are treated in the electronic supplementary material, S5. (Online version in colour.)

