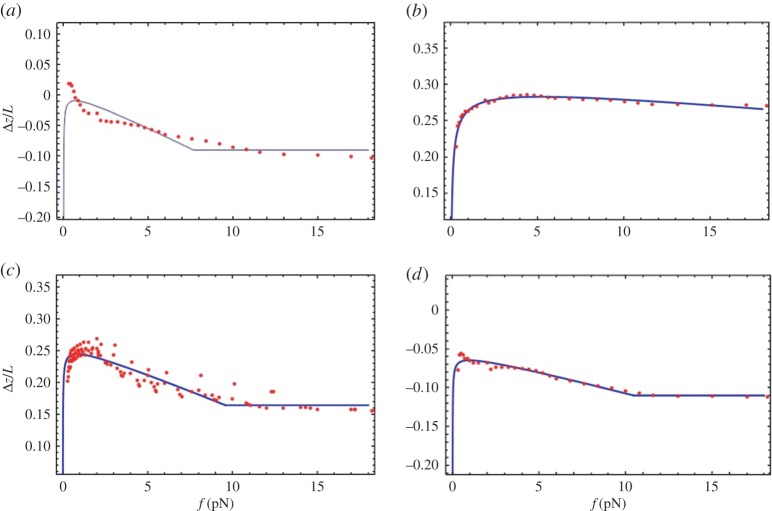
Figure 5.
Fits of Model 2 to experimental extension–force data. The same as in figure 4, but with the curves generated by minimizing equations (3.1) and (3.5). The fit values, of L0 and β, for each experimental run, as well as average values for each temperature and ionic condition considered, are given in the electronic supplementary material, S5. (Online version in colour.)

