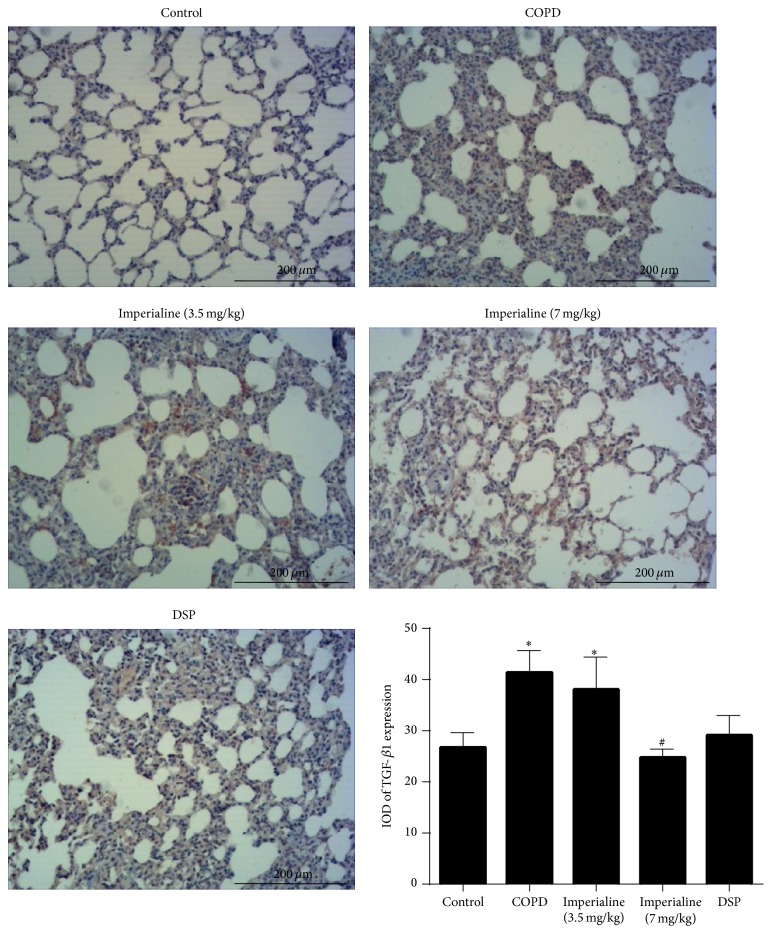
Figure 10.
Immunohistochemical staining of TGF-β1 in lung tissues of rats in different groups and IOD of TGF-β1 expression. Results were expressed as the mean ± SEM (n = 10). Significant differences compared with the control group were designated as ∗ P < 0.05. Significant differences compared with the COPD group were designated as # P < 0.05.

