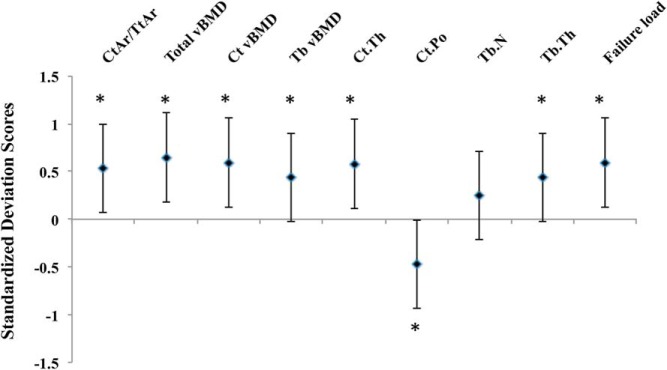
Figure 3.
Standardized difference (in SD units ± 95% confidence interval) in bone microarchitecture variables at the distal tibia for women in the top quartiles of HOMA-IR vs women in the lower quartiles. Zero line indicates the mean of the bottom two quartiles. Differences are expressed as the mean difference between the groups divided by the SD of the lower quartile group. The P value refers to the comparison between the top and bottom two quartiles (*, P < .05).

