
Figure 5.
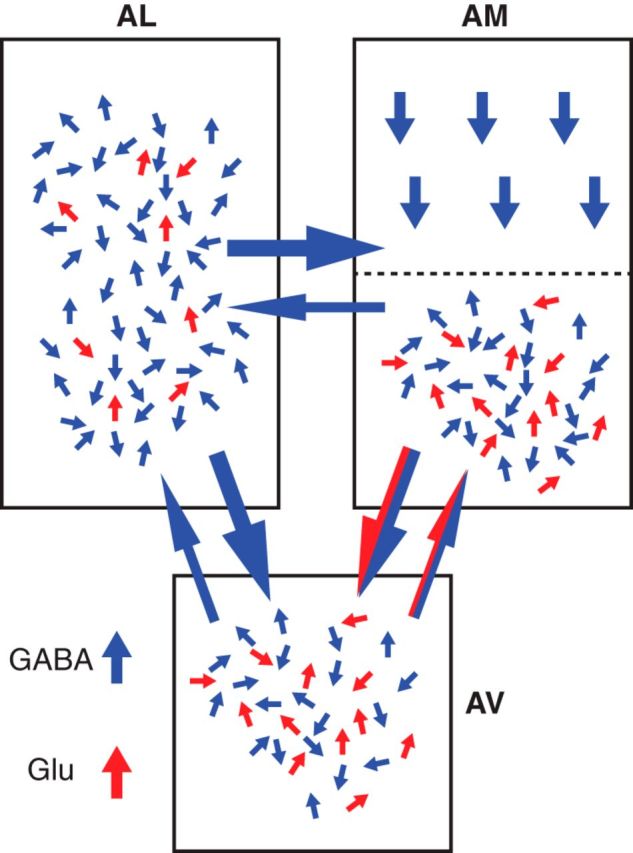
Intrinsic BNST connections. Pattern of intrinsic connections in the anterior BNST, as revealed with glutamate uncaging. Neurons were recorded with the whole-cell method in slices in vitro. Glutamate was uncaged by applying brief flashes of ultra-violet light to a circumscribed region (250 μm in diameter) of BNST. The light stimulus was moved to systematically scan the slice in search of BNST sites containing neurons projecting to the recorded cell. For intraregional connections, the number of blue (GABAergic) and red (glutamatergic) arrows approximates the relative frequency of inhibitory and excitatory connections, respectively. For inter-regional connections, the thickness of the arrows was adjusted to represent the relative incidence of connections. Data from Turesson et al. (2013).