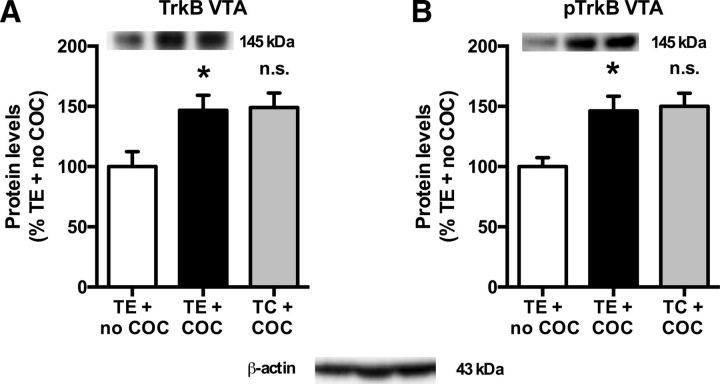
Figure 9.
A, B, No effect of TC on the cocaine (COC)-induced increase in TrkB (A) and pTrkB Y706 (B) protein levels in the ventral tegmental area (VTA). *Significant increase (t test, p < 0.05) vs TE + no COC (A, B). n.s., No difference between TC + COC and TE + COC (A, B). In each panel, values are normalized to TE + no COC, and pictures show representative Western blot bands of the corresponding proteins (left lane, TE + no COC; middle lane, TE + COC; right lane, TC + COC). TE + no COC, n = 10; TE + COC, n = 12; TC + COC, n = 13.

