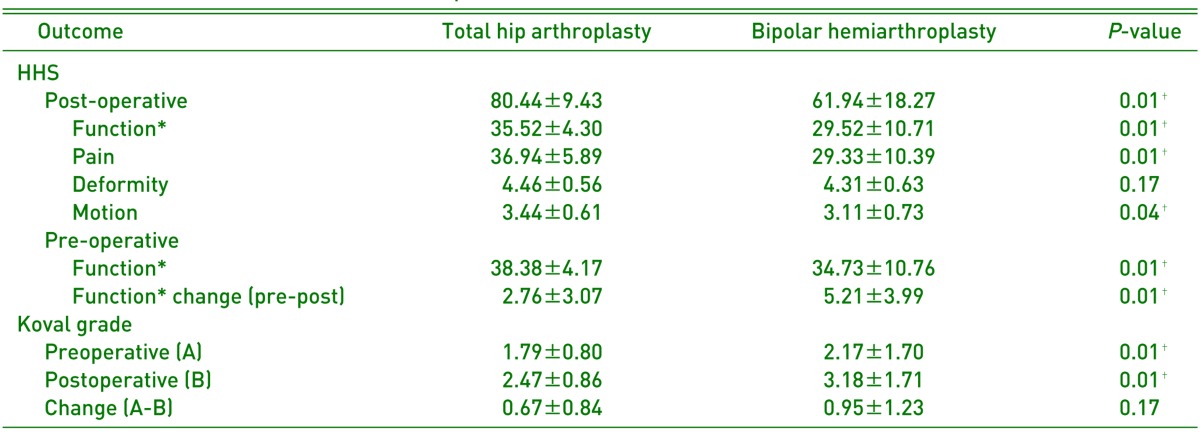
Table 3.
Clinical Outcomes after Last Follow-up
Values are presented as mean±standard deviation.
*Function pertains to Harris hip score questions regarding support, distance walked, limp, activities, stairs, public transportation, and sitting.
†P-values <0.05 were considered to represent statistically significant differences between groups.

