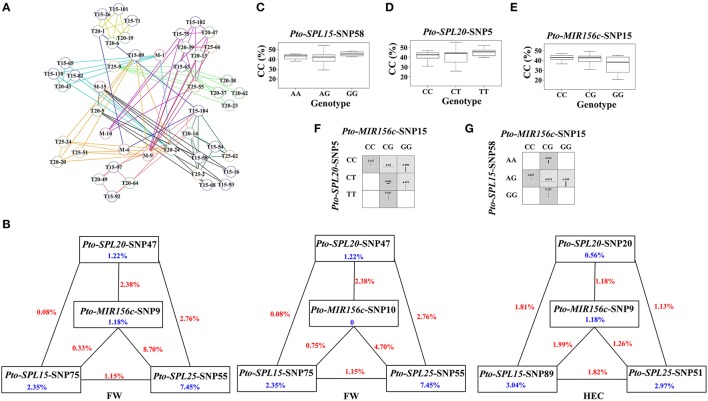
Figure 4.
The epistatic network within the SNPs from Pto-MIR156c and the three potential targets of Pto-miR156c, and the phenotypic variations of single-locus genotypes and pairwise genotypic combinations. (A) A structural network revealed the epistatic interactions of different loci in Pto-MIR156c and its three potential targets. Lines with different colors represent the different associated traits of the SNP pairs, with colors representing the different traits: yellow (height, H), red (stem diameter, DBH), pink (stem volume, V), pale green (holocellulose content, HC), orange (hemicellulose content, HEC), pale blue (lignin content, LC), black (α-cellulose content, CC), blue (fiber length, FL), purple (fiber width, FW), and deep green (microfiber angle, MFA). In addition, the circles with M (red), T15 (blue), T20 (green), and T25 (orange) markers (e.g., T15-63) indicate the associated SNPs from Pto-MIR156c, Pto-SPL15, Pto-SPL20, and Pto-SPL25, respectively. (B) Interaction graph for FW and HEC among SNPs in Pto-MIR156c, Pto-SPL15, Pto-SPL20, and Pto-SPL25. The blue values in boxes represent the single-marker effect, and the red values in lines indicate the pairwise epistatic effect. (C–E) Box plots reveale the single-locus phenotypic variation of different genotypes of three SNPs. (F,G) Square boxes show the pairwise phenotypic variation of different genotypic combinations from different SNP pairs.

