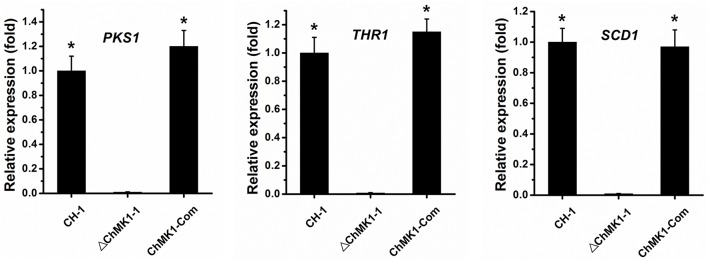
Figure 5.
The relative expression of PKS1, THR1, and SCD1 in CH-1, ▵ChMK1-1, and ChMK1-Com cultured on PDA for 4 d. The relative expression of target genes in CH-1 was set as level 1. Expression level of β-tubulin gene was used to normalize different samples. Bars represent means and standard deviations (three replications). Asterisks indicate statistical differences from the ▵ChMK1-1 (P < 0.05).

