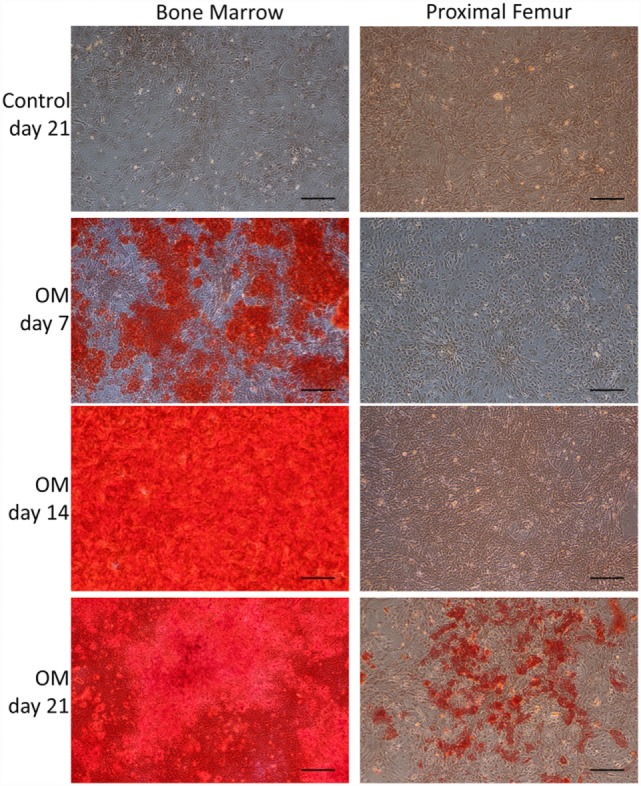
Figure 2.

Characterization of the osteoblastic differentiation potential of bmMSCs and pfMSCs. Cells were treated with osteogenic media (OM) as described under Section “Materials and Methods,” for the number of days as indicated on the figure, and subsequently stained with Alizarin Red S. Images show representative results of three independent experiments, and were taken at 10× magnification, with the size bar = 1 mm.
