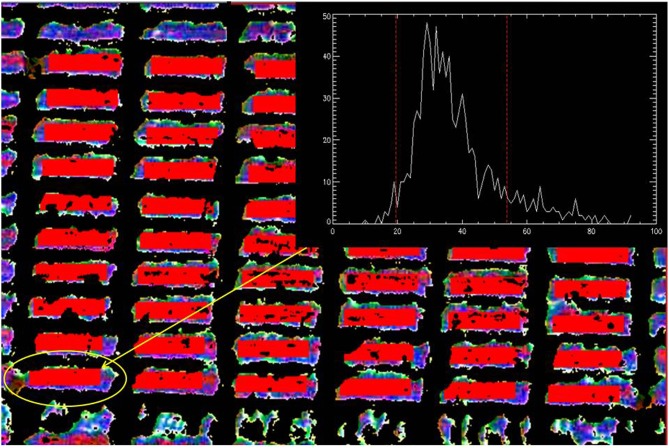
Figure 3.
Example of the image processing using UAV-mounted FLIR Tau image of “HOT” trial shown in Figure 2B where a mask is applied to remove any non-vegetation pixels by applying a threshold for each pixel value. This is followed by the detection of each plot using pre-defined location parameters (red rectangles) and the removal of high variance pixels (using histogram of the pixel values of each plot). An average of pixel values over each band is taken to get a value per band per plot. This value is then subsequently used to calculate the target indices.

