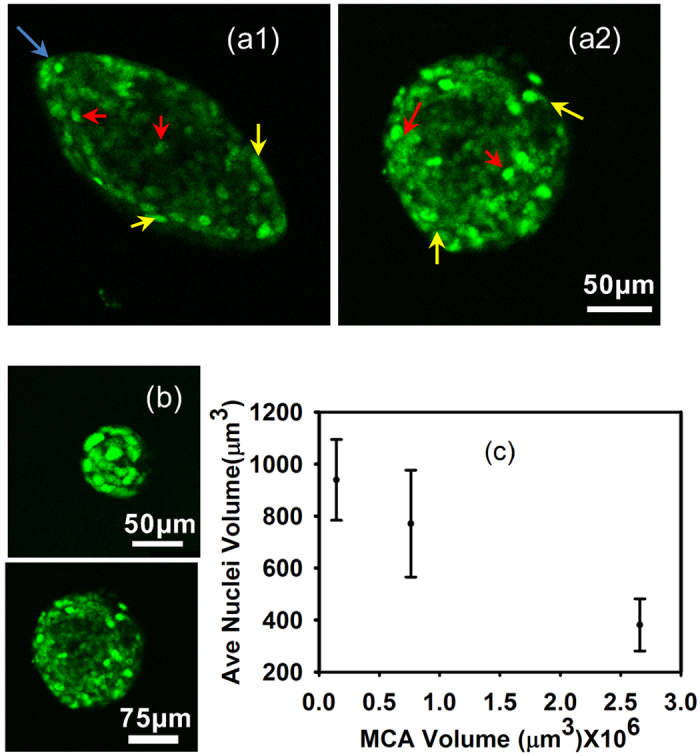
Figure 4. Nuclei deformation at different position of MCAs.

Red and yellow arrows indicate representative nuclei at the sides, center, and the curvature of the MCAs with different sizes and shapes. Both MCA morphologies (spherical and elliptical) shown here have similar volume. (a1) in the elliptical MCAs, cell nuclei on the minor axis, are more elongated and they are more spherical towards the center. Blue arrows indicate the region of highest curvature. (a2) in the spherical MCAs there is little difference between the size of the nuclei throughout the MCA regardless of the position. (b) Spherical MCAs with different volume shows different nuclear size. (c) Nuclear volume as a function MCA volume in spherical MCAs. Means are from 10 to 15 Nuclei in each MCA; Error bars are standard error of the mean. These measurements were done for 2 to 4 MCAs with the same volume and the statistical analysis test shows there is no statistically significant difference between the inputs (P-value = 0.5–0.6).
