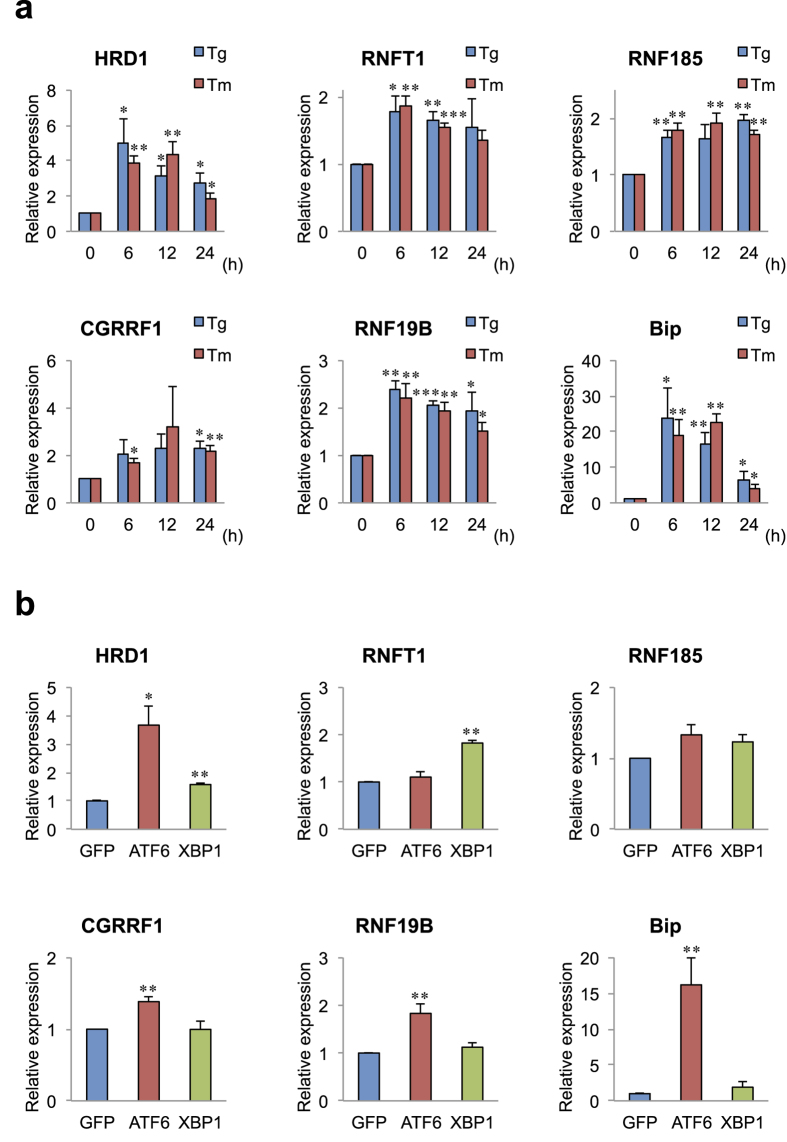
Figure 2.
ER stress response of transmembrane E3 ligases (a) Expression of E3 ligases induced by ER stressor. HeLa cells were treated with thapsigargin (Tg; 1 μM) and tunicamycin (Tm; 3 μg/ml) for the time periods as indicated. Total RNAs were reverse-transcribed and measured by TaqMan-based real-time PCR assay using the delta–delta Ct method. Data are normalized to the amount of GAPDH; results are expressed as the fold increase compared with control (mean ± SD; n = 4). (b) Expression of E3 ligases induced by the overexpression of ATF6 and XBP1. pcDNA3–ATF6α (1–373 amino acid residues),–XBP1 (spliced form), or–GFP (as a control) were transfected into HeLa cells. The cells were incubated for 36 h. Data are normalized to the amount of GAPDH; results are expressed as the fold increase compared with GFP (mean ± SD; n = 3). Statistical analysis was performed with ANOVA followed by Bonferroni correction (vs. control and GFP; *p < 0.05, **p < 0.01, ***p < 0.001).

