
Figure 5.
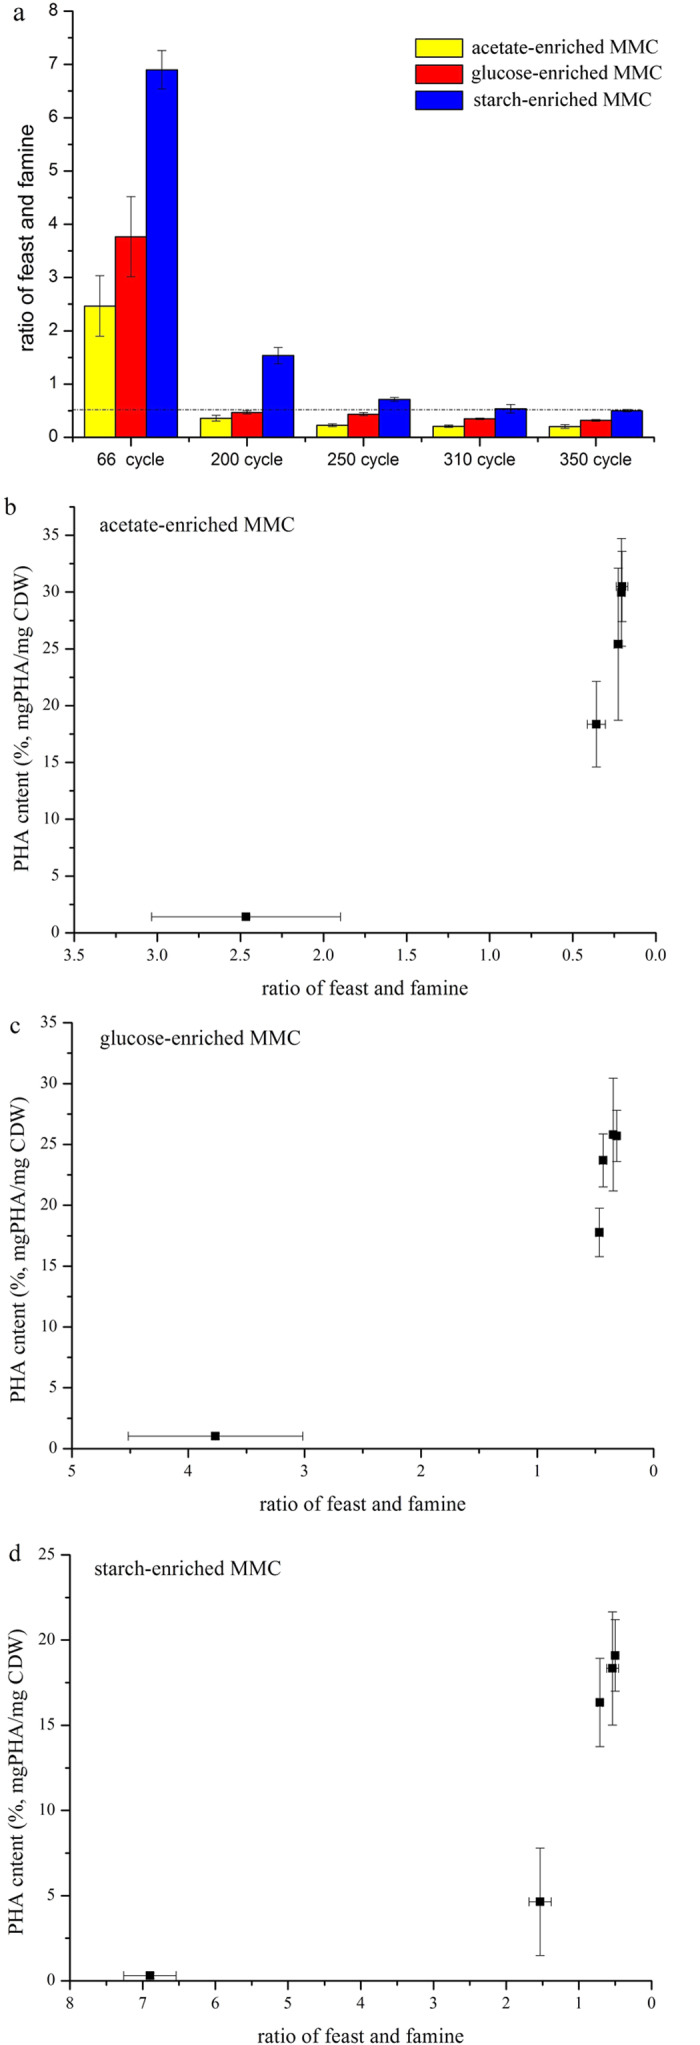
F/F ratio along with the operational time (a), the relationship between maximum PHA content with F/F ratios in the acetate-enriched MMC (b), the glucose-enriched MMC (c) and the starch-enriched MMC (d) during the enrichment periods.
Official websites use .gov
A
.gov website belongs to an official
government organization in the United States.
Secure .gov websites use HTTPS
A lock (
) or https:// means you've safely
connected to the .gov website. Share sensitive
information only on official, secure websites.
F/F ratio along with the operational time (a), the relationship between maximum PHA content with F/F ratios in the acetate-enriched MMC (b), the glucose-enriched MMC (c) and the starch-enriched MMC (d) during the enrichment periods.