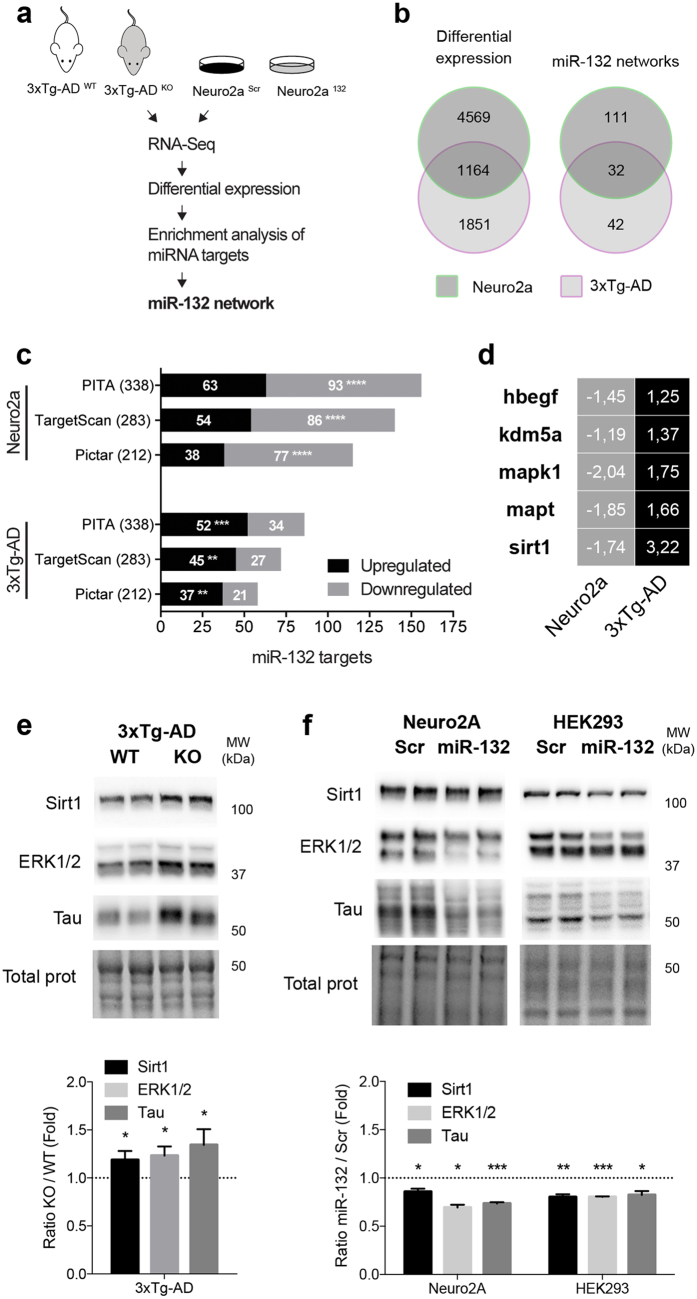
Figure 2. Identification of miR-132/212 targets in vivo.
(a) Schematic overview of RNA-Seq experiments (n = 4/mice or cultures for each group). (b) Venn diagram demonstrating changes of mRNA transcripts between 3xTg-AD and Neuro2a models. Left panel: significant (ANOVA, P < 0.05) changes in expression between mice and cells. Right panel: overlap of transcripts (targets) between miR-132/212 networks in mice and cells. (c) Bioinformatics analysis of miR-132/212 targets in up- or down-regulated set of genes. (d) Heatmap analysis of validated miR-132/212 targets in 3xTg-AD and Neuro2a systems. (e) Western blot analysis of Sirt1, ERK1/2, and Tau in 3xTg-ADWT and 3xTg-ADKO mice (n = 10 mice for each group). Total proteins were used as normalization control. (f) Western blotting of Sirt1, ERK1/2, and Tau in native Neuro2a and HEK293 cells following miR-132 transfection (n = 3 cultures in triplicate per group). Total proteins were used as normalization control. In (b), data are presented as P values *P ≤ 0.05, **P ≤ 0.01, ***P ≤ 0.001, ****P ≤ 0.0001 (Fisher’s exact test). In (d,e), data are presented as mean ± SEM. *P ≤ 0.05, **P ≤ 0.01, ***P ≤ 0.001, ****P ≤ 0.0001 (Student’s t-test). Full-length blots/gels are presented in Supplementary Fig. S6.

