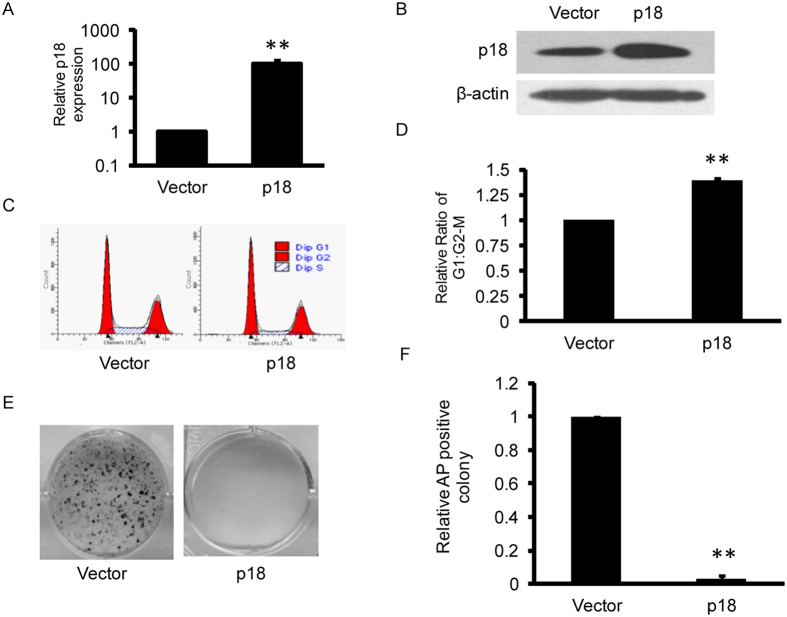
Figure 3. Overexpression of p18 blocks reprogramming.
(A) Relative expression of p18 mRNA in MEFs transfected with empty vector or vector expressing p18 cDNA. The results are presented as the mean ± SD of three independent experiments; **P < 0.01. (B) Western blot analysis of whole cell extracts from MEFs transfected as in (A). Actin serves as a loading control. (C) Histograms of DNA contents in cells transfected as in (A). (D) p18 overexpression significantly increases the proportion of cells in G1 phase. Data are shown as mean ± SD; n = 3, *P < 0.05. (E) Alkaline phosphatase (AP) staining of iPSC colonies generated from control cells or cells overexpressing p18. (F) p18 overexpression blocks reprogramming. AP-positive colonies were counted and normalized to cells transfected with empty vector. Data are shown as mean ± SD; n = 3, **P < 0.01.

