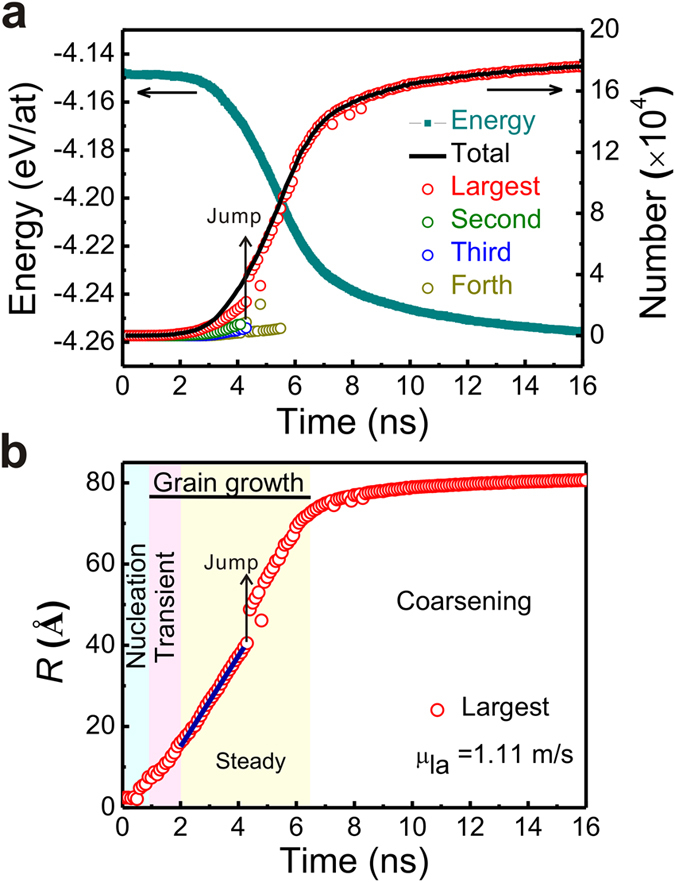
Figure 2. The time evolution of crystallization.

(a) Potential energy and the number of crystalline atoms (N-T curve) in the whole system and (b) effective radius of the largest grain (R-T curve) of Ni50Al50 alloy annealing at 950 K. (b) The linear fit (blue lines) gives the growth rates of the largest grain. Note that the colors of the background are used to identify the different stages in the following figures.
