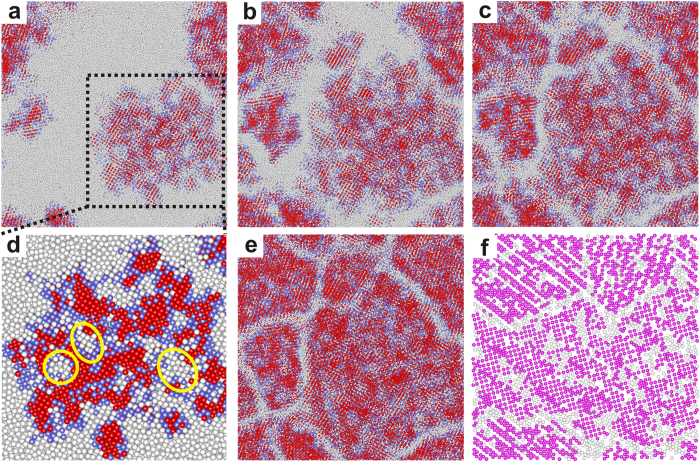
Figure 4.
Projections from the cross section of the simulation box at (a) 3.9 ns, (b) 5.1 ns, (c) 6.1 ns (d) magnified grain at 3.9 ns and (e) 16.0 ns. The white, blue and red balls stands for atoms distributed in the disorder regions, NLRO regions and ELRO regions, respectively. (f) A snapshot of a slice of the simulation box at 16 ns, showing the configuration inside the simulation box. The purple balls represent the sum of the NLRO and ELRO atoms.

