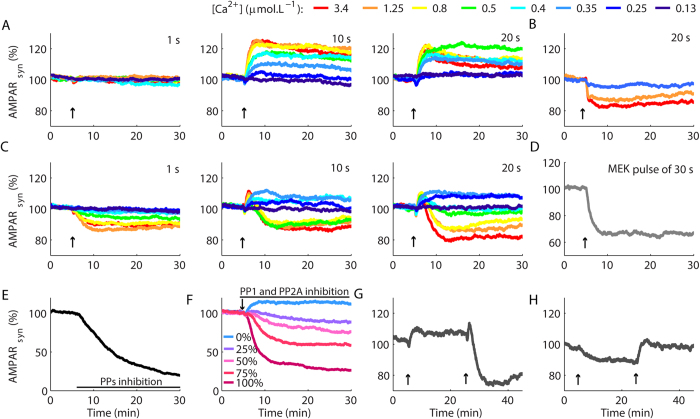
Figure 2. Macroscopic curves of LTP and LTD.
(A) In the absence of αCaMKII, high amplitude Ca2+ pulses of 10 s and 20 s resulted in potentiation. (B) The blockage of CaN restored the occurrence of LTD. (C) LTP and LTD in the model with αCaMKII. (D) A pulse of MEK induced LTD. (E) Inhibition of PP1, PP2A and PP5 promoted a slow LTD. (F) Gradual blockages of PP1 and PP2A resulted in LTD induction with a protocol of LTP (Ca2+ pulse of ~0.4 μmol.L−1 and 20 s). (G,H) Reversible synaptic plasticity. In (G), a Ca2+ pulse of ~0.35 μmol.L−1 and 20 s induced LTP. After 20 min, a second pulse of 4 μmol.L−1 and 20 s induced LTD. In (H) we induced weak LTD with a Ca2+ pulse of ~0.9 μmol.L−1 and 1 s, and restored the basal level of AMPARsyn with a Ca2+ pulse of ~0.35 μmol.L−1 and 30 s. Each curve in (A–D) is the average result of 100 runs of the model, and in (E–H) the average of 50 runs. The arrows indicated the occurrence of the Ca2+ pulses. We omitted the standard errors of the mean (SEM) for better visualization. The curves with the mean ± SEM are showed in Supplementary Fig. S2.

