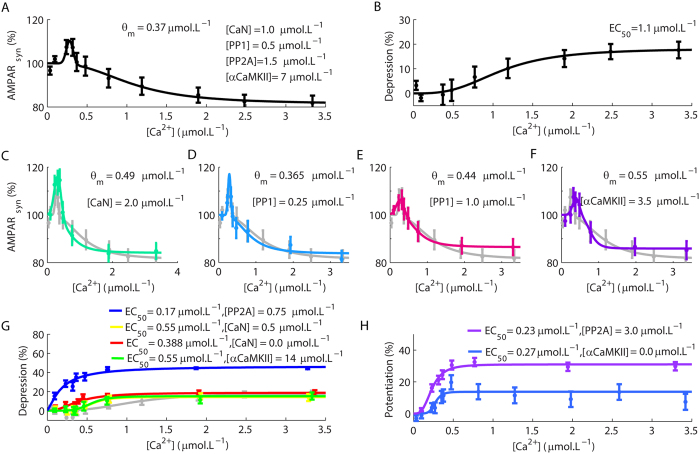
Figure 5. Macroscopic Ca2+ thresholds for the occurrences of synaptic modifications.
(A,B) An inverse BCM rule (A) and a sigmoid function (B) described the correlation between the macroscopic synaptic modifications and the magnitudes of Ca2+ pulses according to the range of Ca2+ amplitudes analysed. The term EC50 stands for the [Ca2+] required to achieve half-maximum LTD. (C) Simulations performed with higher [CaN] (the control concentration of CaN and other components of the model are indicated in (A)). (D,E) A reduction of [PP1] (D) had little effect on the overall behaviour of the model, but an increase (E) in its concentration changed θm. (F) Reduction of [αCaMKII] altered the value of θm of the inverse BMC rule. In (C–F) the light gray line corresponds to the results obtained with the control model (A) replotted for comparison. (G) An increase of [αCaMKII] or a reduction of [CaN] or [PP2A] suppressed the occurrence of LTP (the control result (B) was replotted in gray for comparison). (H) The elevation of [PP2A] or the absence of αCaMKII resulted in the suppression of LTD. Each dot in the panels is the mean + SEM calculated for 100 simulations. The duration of the Ca2+ pulses was 20 s for all simulations.

