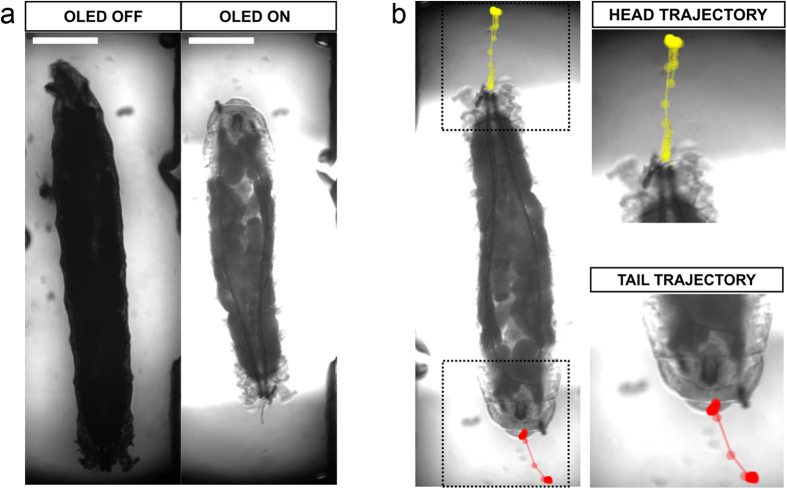
Figure 2. Imaging and analysis of Drosophila larval behaviour.
(a) Example frames showing Drosophila larval morphology before (left) and during (right) blue OLED illumination. Scale bars: 0.5 mm. (b) Screen-capture images illustrating the analysis routine. Head and tail positions for each larva were tracked in each frame and head-tail distances calculated from these coordinates.

