
Figure 3. Movements in ChR2(H134R)-Drosophila larvae driven by optical stimulation with pin OLEDs.
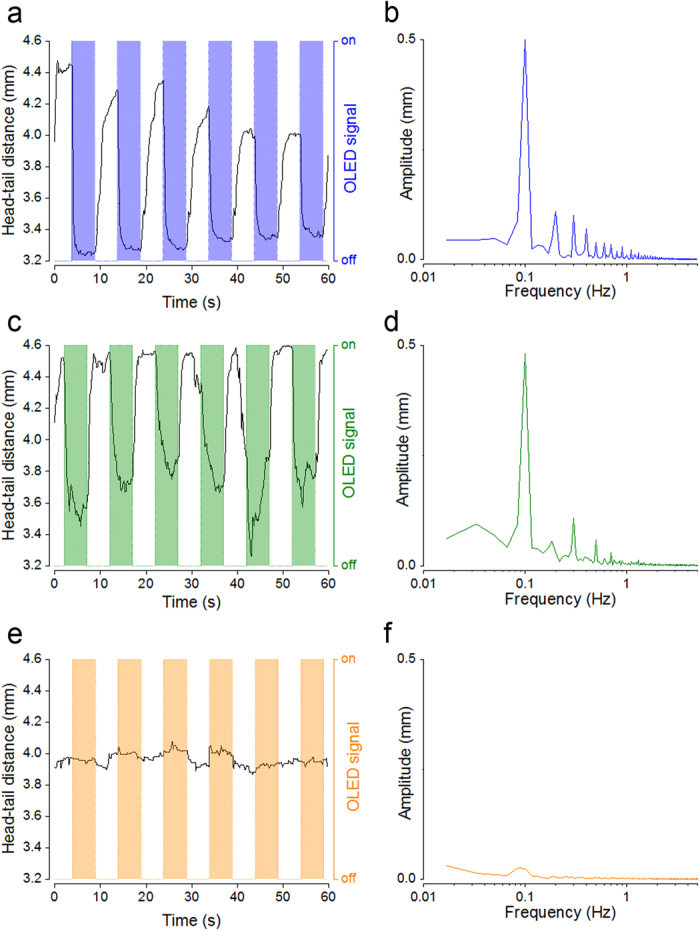
Repeated cycles of OLED illumination (5 s on −5 s off; 5 V square wave voltage pulse) were delivered from blue, green or orange OLEDs located beneath the larvae. Example head-tail distance traces (solid black lines) from larvae repeatedly stimulated with a blue (a), green (c) or orange (e) OLEDs. Shaded areas indicate when each OLED was on. (b,d,f) Corresponding Fourier transforms of each head-tail distance trace.