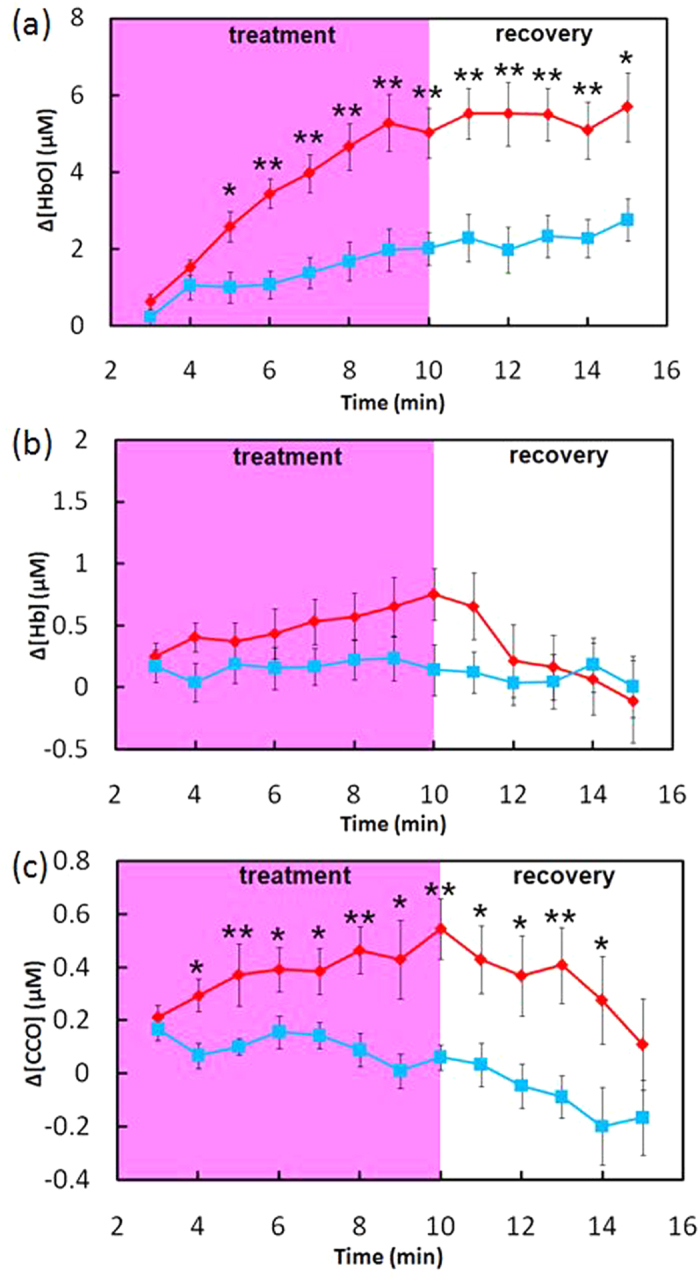
Figure 1.

LLLT (red)/placebo (blue)-induced concentration changes of (a) [HbO], (b) [Hb], and (c) [CCO] in human forearms in vivo (mean ± SE, n = 11). In each subplot, the pink-shaded region indicates the period of LLLT/placebo treatment; *indicates significant differences in respective concentrations between LLLT and placebo treatment (0.01 < p < 0.05, paired t-test). **indicates significant differences in respective concentrations between LLLT and placebo treatment (p < 0.01, paired t-test).
