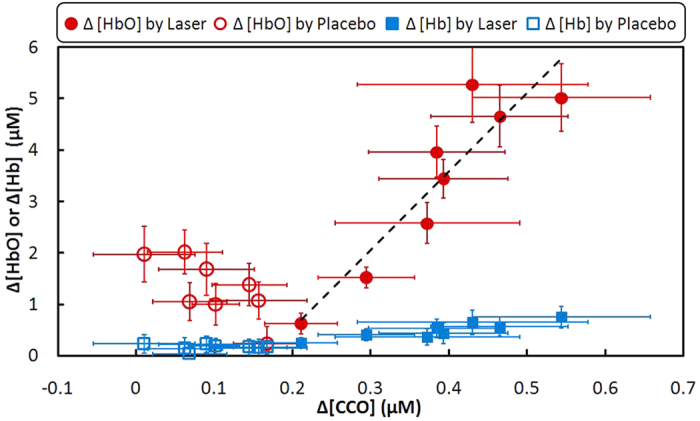
Figure 2. The relationship of concentration changes between CCO vs. HbO or Hb during LLLT and placebo experiment (mean ± SE, N = 11).

The horizontal error bars represent variability of CCO and the vertical error bars represent variability of HbO or Hb. The correlation coefficient of the fitted line is r = 0.92 with a p value of 0.001.
