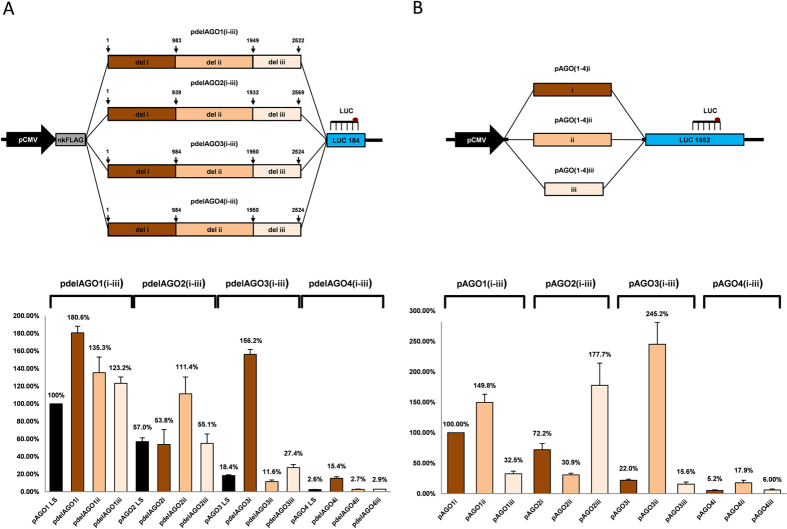
Figure 3. The first 1000 nt downstream the promoter significantly affect gene expression rate.
(A) (Upper part): Structure of pdelAGO(1–4)i, pdelAGO(1–4)ii and pdelAGO(1–4)iii, the deletion mutants of the pAGO(1–4)LS-nk plasmids, used for transient overexpression of deleted AGO coding sequences. The location of each deleted region (i, ii or iii) is shown on plasmid DNA map for each AGO gene. (Lower part): TaqMan qPCR analysis of relative overexpression of exogenous transcripts 24 h after transfection of parental pAGO(1–4)LS-nk and deleted constructs in U2OS cells. (B) (Upper part): Structure of pAGO(1–4)i, pAGO(1–4)ii and pAGO4(1–4)iii used for transient overexpression of sequential parts of AGO coding regions upstream the full-length luciferase gene. The overexpressed AGO regions (i, ii, iii) corresponded exactly to the deleted regions in the pdelAGO(1–4) constructs. (Lower part): TaqMan qPCR analysis of relative overexpression of exogenous transcripts 24 h after transfection of U2OS cells with pAGO(1–4)i, pAGO(1–4)ii and pAGO(1–4)iii. All qPCR data is presented as mRNA levels relative to cells transfected with full-length AGO1 encoding plasmids (A) or region i of AGO1 (B), and normalized on the NeoR mRNA levels for each transfection. Each bar represents mean + S.D of three independent transfections.

