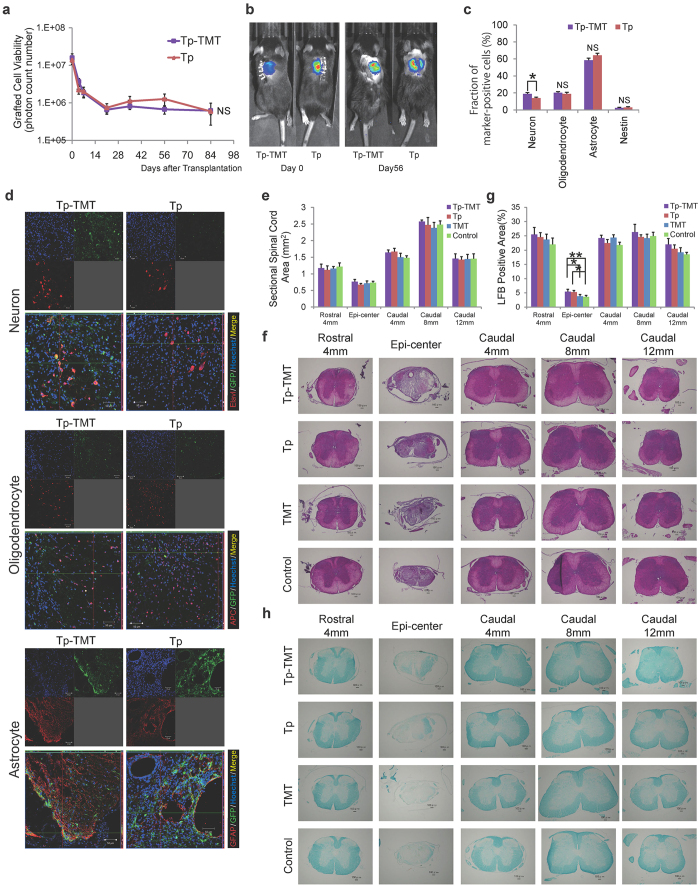
Figure 1. The effects of interventions for neural stem/progenitor cells.
(a) Quantitative analysis using bioluminescence imaging (BLI) revealed that the survival rates of grafted cells were comparable between the Tp and Tp-TMT groups up to 84 days post-transplantation (the vertical axis has a logarithmic scale). Statistical analysis was performed using 2-way repeated measures ANOVA (Tp-TMT: n = 18, Tp: n = 19). (b) Representative BLI of animals in both groups. (c) The differentiation rate of grafted cells into the three neural cell lineages at 84 days post-transplantation. The proportion of Elavl+ cells is significantly higher in the Tp-TMT group than in the Tp group. No significant difference was observed in GFAP+ and APC+ cells. Only a small number of nestin + immature neural progenitor cells were observed in both groups. Statistical analysis was performed using paired T-tests (n = 6). (d) GFP positive grafted cells differentiated into Elavl+ neurons, GFAP+ astrocytes, and APC+ oligodendrocytes in Tp and Tp-TMT groups at the caudal site of the lesion (from the lower part of T9 to T10 level). Scale bar: 50 μm. (e) The sectional spinal cord area at each spinal level, which was similar in all four groups assayed. Statistical analysis was performed using the Tukey-Kramer test (n = 6). (g) The myelinated area at each spinal level, which was significantly larger in the two transplanted groups (Tp and Tp-TMT groups) than in the two non-transplanted groups (TMT and Control groups). Statistical analysis was performed using the Tukey-Kramer test (n = 6). (f,h) Representative HE- and LFB-stained images of axial sections at each level in each group. Images of each group were obtained from identical animals. Scale bars: 100 μm. *P < 0.05, **P < 0.01. Values are means ± SEM.

