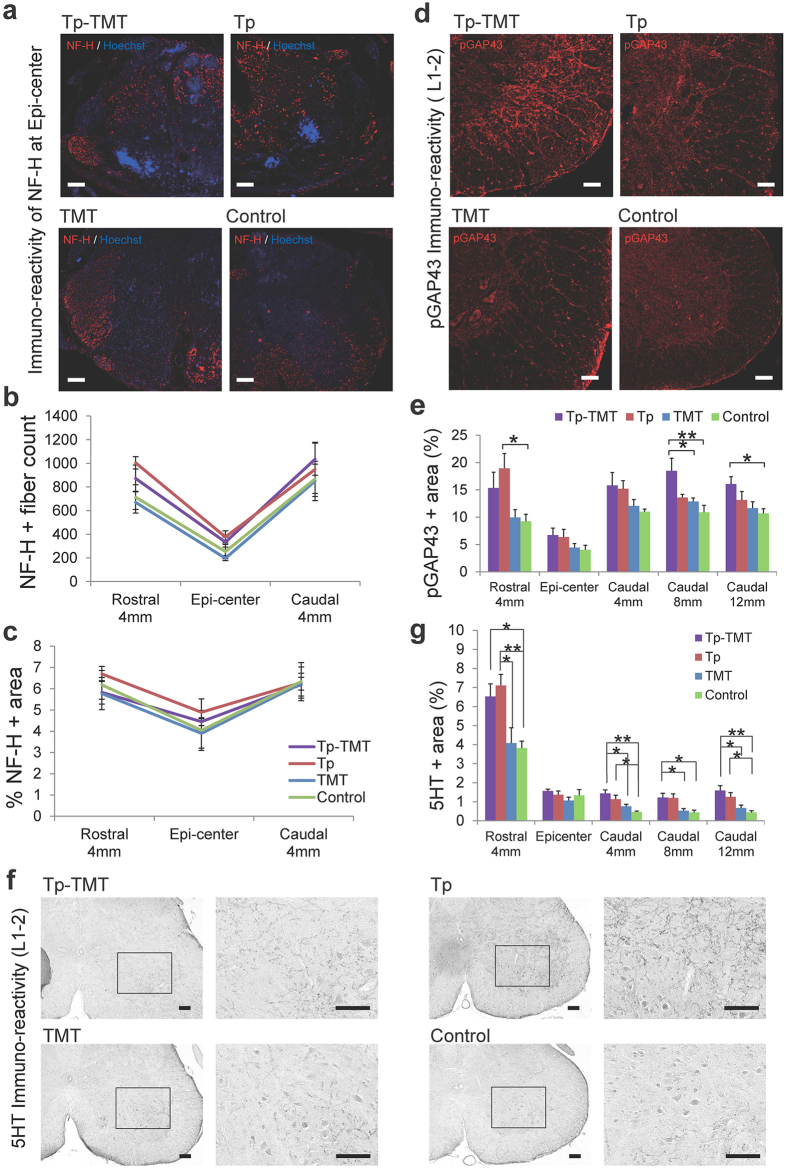
Figure 2. Fibres running through the lesion epicentre and lumbar enlargement.
(a) Representative images of axial sections stained for NF-H around the lesion epicentre. (b,c) NF-H quantified with an NF-H+ dot count (b) and NF-H+ area (c). The values around the lesion epicentre were similar across the four groups for both assays. (d) Representative images of axial sections stained for pGAP43 at the lumbar enlargement. (e) Quantification of pGAP43+ area at the lesion epicentre and 4 mm rostral and 4, 8, and 12 mm caudal to the lesion across the four groups. Values increased in the two transplanted groups rostral to the lesion and were significantly greater only in the Tp-TMT group caudal to the lesion. (f) Representative images of axial sections stained for 5HT. (g) The areas of 5HT+ serotonergic fibres were significantly larger in the two transplanted groups, both rostral and caudal to the lesion epicentre, except for the epicentre itself. Statistical analyses were performed using the Tukey-Kramer test. Values are means ± SEM (n = 6). *P < 0.05, **P < 0.01. Scale bars: 100 μm in (a,d,f).

