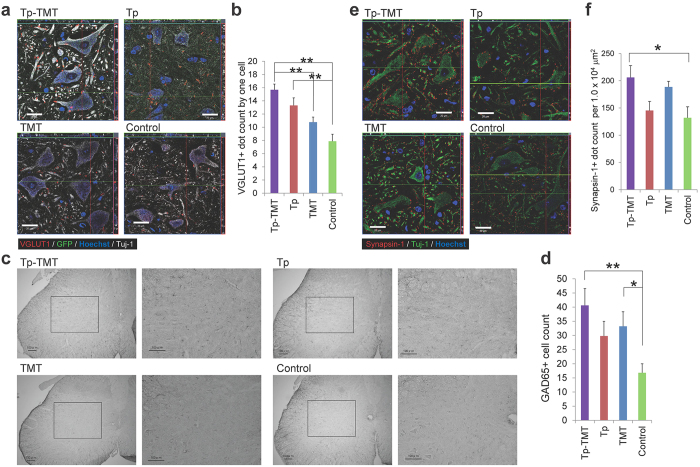
Figure 3. Effects of interventions on the neural circuit at the lumbar enlargement.
(a) Representative images of axial sections stained for VGLUT1 at the anterior horn of the lumbar enlargement. (b) VGLUT1+ boutons are significantly increased in the two transplanted groups. Statistical analysis was performed using the Tukey-Kramer test. (c) Representative images of axial sections stained for GAD65 at the lumbar enlargement. (d) The number of GAD65+ cells is significantly higher in the Tp-TMT group than in the Control group. Statistical analysis was performed using the Tukey-Kramer test. (e) Representative images of axial sections stained for Synapsin-I at the anterior horn of the lumbar enlargement. (f) Synapsin-I+ boutons are significantly more numerous in the Tp-TMT group than in the Control group. Statistical analysis was performed using the Tukey-Kramer test. Values are means ± SEM (n = 6). *P < 0.05, **P < 0.01. Scale bars: 20 μm in (a,e), and 50 μm in (c).

