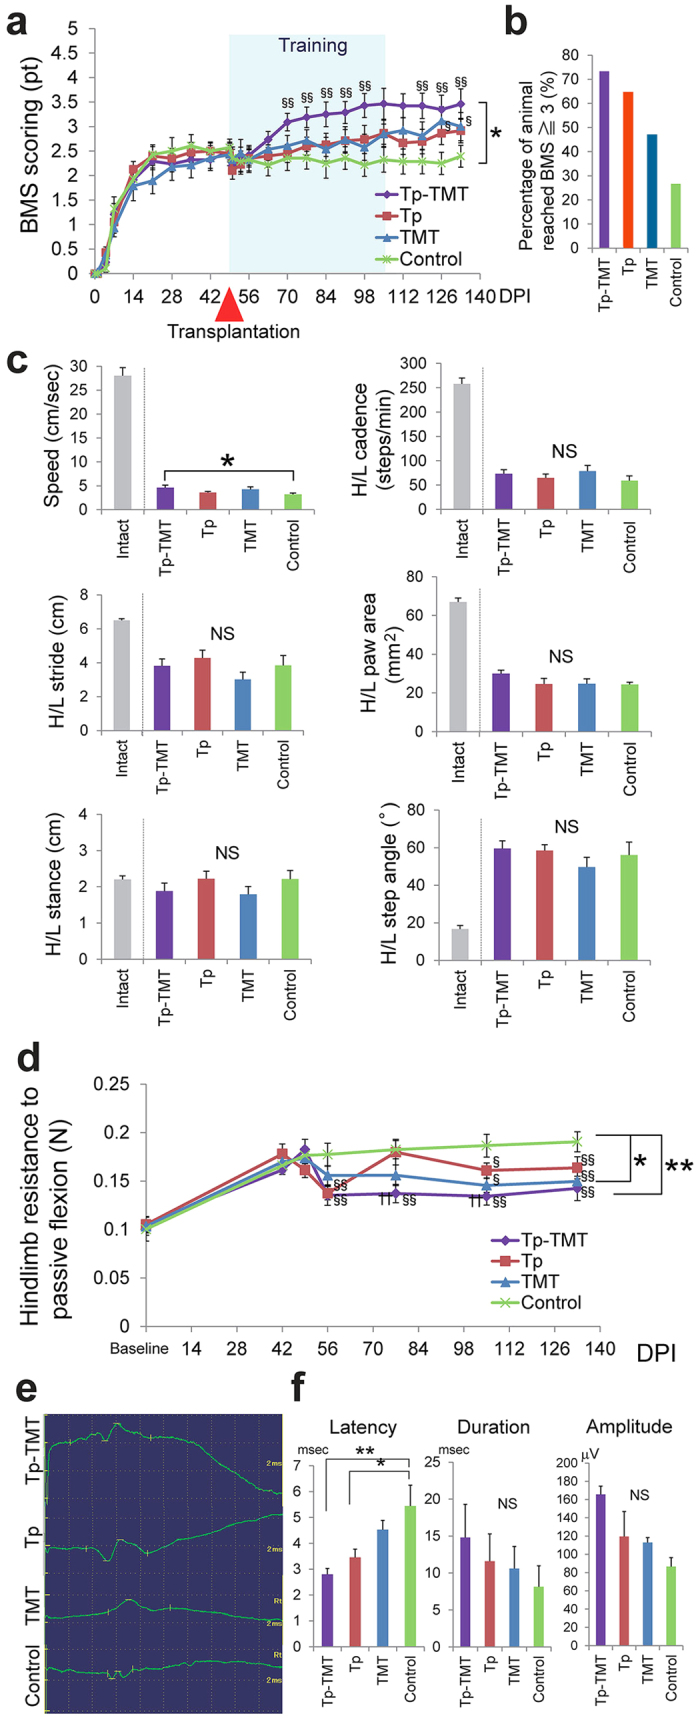
Figure 4. Behavioural and electrophysiological manifestations in each group.

(a) The locomotor recovery represented by the Basso Mouse Score (BMS) in each of the four groups. The Tp-TMT group exhibited significantly better functional recovery than the control group. Statistical analyses were performed using repeated measures ANOVA followed by point to point comparisons (Tp-TMT: n = 18, Tp: n = 19, TMT: n = 17, Control: n = 16). *P < 0.05, in repeated measures ANOVA. §§P < 0.01 and §P < 0.05 compared to Control group in Tukey-Kramer tests. (b) The percentage of animals reaching a score of 3 or above in the BMS scoring. (c) Gait dynamics assessed as gait speed, hindlimb (H/L) step pitch, H/L stride length, H/L stance width, and H/L step angle in each of the four groups at 133 days post-injury (DPI). The values for intact mice are cited from previous studies74,75. Statistical analyses were performed using Tukey-Kramer tests (Tp-TMT: n = 15, Tp: n = 15, TMT: n = 12, Control: n = 11). *P < 0.05, NS: Not significant. (d) The transition over time of the resistance to flexing of animals’ hindlimbs, which were passively measured using a strain-gauge in each of the four groups. The spasticity in the Tp-TMT and TMT groups was significantly reduced compared with the Control group. Statistical analyses were performed using repeated measures ANOVA followed by point to point comparisons (Tp-TMT: n = 16, Tp: n = 15, TMT: n = 15, Control: n = 13). *P < 0.05 and **P < 0.01, in repeated measures ANOVA. §§P < 0.01, §P < 0.05 compared to Control group, and ƗƗ P < 0.01 compared to Tp group in Tukey-Kramer tests. (e) Representative MEPs in the four groups at 133 DPI. (f) The latency, duration, and amplitude of the MEP are shown. The latency was significantly shortened in Tp-TMT and Tp groups. Statistical analyses were performed using Tukey-Kramer tests (Tp-TMT: n = 10, Tp: n = 10, TMT: n = 10, Control: n = 9). *P < 0.05. Values are means ± SEM.
